Episode #8 | Ad Hoc Reporting and Why It Matters for Businesses
🔍 Dive into the world of ad hoc reporting with Vadym and Ievgen on this episode of The Data Crunch Podcast. They explore why this flexible, on-demand reporting approach is revolutionizing business decision-making, offering a deep dive into its functionality and benefits.
📈 Discover how ad hoc reporting empowers users to instantly generate personalized reports, addressing specific business questions without delays. Ievgen explains how this method allows direct access to needed data, supporting dynamic business environments with timely insights.
🚀 Transform how your team interacts with data using OWOX BI, making ad hoc reporting seamless and efficient. Equip your business with the tools to make faster, more informed decisions and stay competitive. Start your journey at owox.com: [LINK with the UTM]
🔗 Stay ahead of the curve by subscribing to The Data Crunch Podcast for more practical tips on harnessing the power of data in your business operations.
Dive deeper with this read
Understanding Ad Hoc Analysis and Ad Hoc Reporting: A Comprehensive Guide for Businesses
Podcast listing
Vadym:
Hi everyone! Welcome back to The Data Crunch Podcast. I’m your host Vadym, Growth Marketing Manager here at OWOX. Today, we’re diving into a topic that’s revolutionizing how businesses utilize data— ad hoc reporting.
Joining me and Ievgen, our Head of Marketing, to unpack why this way of making reports is essential, how they differ from traditional methods, and what benefits they bring to businesses. Hey, Ievgen! Great to have you here.
Ievgen:
Thanks, Vadym! Always a pleasure. This is such an important topic because reporting tools and methods have come a long way, and ad hoc reporting has really stepped up to meet the needs of modern businesses.
Vadym:
Absolutely. Let’s kick things off by defining what ad hoc reporting is. Can you break it down for us, Ievgen?
Ievgen:
Of course! So ah hoc reporting typically refers to the process of creating reports on-demand to address specific, usually - immediate, business questions or needs.
So creating reports on the fly to make decisions quickly.
Instead of relying on pre-built dashboards or waiting on data analysts, business users can generate reports tailored to specific questions they need to answer or their needs.
Well, sometimes this process should and will include data folks inside, but more on the environment-creation stage so to say. So data analysts or engineers, or IT teams are setting up the tool so business users can get reports they need quickly. Based on the predefined data and JOIN keys. So end users can get reports they need quickly but also this process should be manageable or audible by the data teams.
For example, if you want to know how many support tickets were resolved last week or how many calls a salesperson completed yesterday, you, as a business user, should not be waiting for data folks to get answers quickly.
Vadym:
So, it’s like having a personalized reporting tool that lets you dig into the data when you need it without jumping through hoops.
Ievgen:
Exactly. And the best part? It’s not just about numbers.
Because the easier the ad-hoc reporting tool is, the more chances - end users would be able to add visuals: using graphs, charts, or tables to make those data insights clearer and easier to act on right away.
Vadym:
That sounds like a game-changer. But let’s talk features. What makes a good ad hoc reporting tool stand out?
Ievgen:
Basically, I Don’t want to talk too much about specific tools names here.
The best one is Google Sheets - for sure. But there is typically no data in it.
So instead, I’d rather table about the principals we envision and the possibilities that ad-hoc reporting process should bring in.
There are a few key things to look for:
NUMBER 1: Access to REQUIRED data from multiple sources.
This is very important. You should have access to the data you need for reporting.
If you’re a marketer - probably you need what? Website Sessions, leads, customers, adspend, pageviews - those kind of stuff.
That data lives in different worlds - google analytics, facebook ads, google ads, sales CRM…
And that’s where the thing 2 comes into place.
You should have a single storage for those data. Not you specifically, your business. That data should live in any sort of a data warehouse like Google BigQuery or Snowflake. Because Marketing is not alone.
The best way to have all the departments working with the same data is modeling the business data inside the warehouse.
Creating those OBJECTS that live in real life. Like I mentions, sessions, adspend, visitors, leads, clients, products, orders, brands, you name it. It really depends on the industry, but even then it’s super specific for the business.
Vadym: Great. So we have access to the data and then the corporate storage, you’ve mentioned a warehouse. What’s next?
Ievgen: Oh yes. Number #3 is the right setup made by a data professional.
Or by the tool.
Most of the reports are multi-source.
If you need a single source report - you’d probably look in the platform itself.
Like pageviews in Google Analytics, or facebook adspend.
But if you need the overall advertising expenses mapped to the sessions on the website and the conversions those campaigns generated - you need those data to be CONNECTED.
But here is the thing: there is plenty of ways to connect the data. And most of them are incorrect. This is where the data professional should teach the reporting tool to JOIN the data in the right way.
We call this - creating a source of truth.
Vadym: I love this. So, creating a single source of truth within the organization to work with the same data across all the departments. But how to deliver this source of truth to business users?
Ievgen: So the next thing to do - is to connect the dots between those objects: sessions, visitors, leads, clients, etc., and create data marts that business users can use.
Data mart is typically the SQL Query with all of the fields potentially inside each of the objects PLUS the JOIN keys between the fields.
So that’s the source of truth.
Business user can then just filter this out, run the query into Google sheets, sort, select the fields he really needs for this specific report,
PLAY with data, VIsualize it,
Maybe build a few of the other reports like that but for different combinations of filters - so to say cohorts,
and then automate updates on a schedule if he really needs that more than once.
But that’s really the best way to make decisions in day-to-day operations.
Official Youtube Channel
Master Analytics with OWOX BI
- Insider Tips
- Analytics tutorials
- Live Training
- Product walkthroughs
Vadym: Great. Let’s clarify the steps one by one.
Ievgen: Ok, so (1) data professional collects all the business data into a data warehouse and then models that data into objects.
(2) Then it’s time to create trusted data marts based on those objects.
(3) So at the end a business user : a marketer, finops, product manager, sales - anyone within the business - then just grabs the data mart from the list named lets say “Blended AdSpend Report” and runs it into Google Sheets.
(4) Maybe he doesn’t need some of the traffic sources, so he just filters that data out, or specifies the date range, then sorts campaigns by Revenue descending and that it.
(5) If you’re a visual person - go get a chart in Google Sheets. There is no other visualization tool that is so easy to use.
And then if you like that report - Just set it to update every workday, Monday to Friday at 8 am and visit this document every day to check it all out and make decisions.
Look. I have about 10 documents each with 3 to 5 separate reports build around our marketing performance: Blog performance, Traffic reports, Clickable elements stats, Channel performance, Search Trends, a small overall dashboard with our results, I even have a single document calculating your performance man, with all of your KPIs to add you the bonuses on time - you’ve seen it. And that KPI sheet grabs data from multiple places, so I have 5 data marts feeding it.
Vadym:
Got it. So, this way of building reports is designed to empower business teams, not just data analysts.
Ievgen:
Exactly. Ad-hoc reporting is about making data accessible to whoever they need, when they need in the form that is the easiest to digest..
Vadym:
Let’s switch gears for a moment. Traditional reporting tools have been around for a while, but they don’t quite cut it anymore. Why is that?
Ievgen:
Traditional BI tools, like nice and fancy dashboards: looker studio, power bi - they were great in their time. But the problem is they’re rigid. They provide predefined reports that don’t allow the business user to explore data beyond the set parameters.
And businesses today deal with vast amounts of data from multiple sources—ad platforms, social media, CRM systems, internal systems, market researches, tools, platforms.
To make informed decisions, business users need reports that adapt to their questions, not the other way around.
Vadym:
Right, and I imagine this lack of flexibility can slow things down.
Ievgen:
So technical complexity of the BI tools create bottlenecks.
Analysts are overwhelmed with requests, decisions are delayed, and growth opportunities are missed.
Vadym:
That’s where ad hoc reports come in, right?
Ievgen:
Exactly. Companies already have tons of data, but the challenge is extracting powerful insights from it.
Dashboards can’t twist and spin data in all the ways that end users need. They’re static, which means businesses miss opportunities to improve processes and get more money.
Ad hoc reporting changes the game. It allows business users to quickly access and analyze data on demand. Need to know why your latest campaign didn’t perform as expected? You can dive into the data immediately, uncover insights, and adjust your strategy in real time, instead of going to the data analyst and saying something like “I’ve seen we are doing bad … please get me a report specifying this and than.”
Vadym:
And the data professional says: “great. Your position is #11 in the Queue. I expect you’ll get this in 2 weeks”, yes?
Ievgen:
Oh yes, but you’re missing on this right now. Not tomorrow, not in 2 weeks, you can wait this long.
Vadym:
So it’s not just about reporting; it’s about making faster decisions, right?
Ievgen:
That’s right. Faster and data-backed.
Ad hoc reporting empowers businesses to be more agile, which is essential in today’s fast-paced environment.
Vadym:
Let’s clarify something for our listeners. How do ad hoc reports differ from canned reports?
Ievgen:
Great question! Canned reports are predefined. They’re generated regularly, like weekly sales summaries or monthly performance reviews. They’re great for tracking trends but lack flexibility.
Ad hoc reports, on the other hand, are created on demand. They’re tailored to specific questions.
But sometimes, they stay with us for longer than just a day or two.
Need to know why sales dipped last week? An ad hoc report can give you the answer immediately.
Vadym:
So, it’s flexibility versus routine. Both have their place, but ad hoc reports give you that edge when you need quick answers.
Ievgen:
Exactly. They complement canned reports by filling in the gaps for more immediate, dynamic needs.
Vadym:
Let’s talk benefits. Why should businesses prioritize ad hoc reporting?
Ievgen:
There are so many reasons:
Improved efficiency—No waiting on IT teams for reports.
Increased accuracy—You can dig into the data and uncover trends dashboards might miss.
Empowered teams—because business users become more comfortable navigating data themselves.
Cost savings—Less reliance on IT means lower costs. That’s pretty expensive, right?
Vadym:
Sounds like a win-win. But what about the challenges?
Ievgen:
Like anything, ad hoc reporting has its hurdles.
But when done properly, around the data marts and the source of truth - there is no significant drawbacks.
Yeees, not everyone has the data literacy to interpret these reports effectively. That’s why it’s important to invest in processes and trainings. Because that is the future.
Vadym:
I see… So, it’s about balance—using ad hoc reports for immediate insights while ensuring they’re part of a bigger strategy.
Could you give us some real-world examples of how businesses use ad hoc reporting?
Ievgen:
Absolutely. Here are a few:
Sales teams analyze performance by region or product.
Marketers track campaign effectiveness and optimize targeting.
Finance teams identify cost-saving opportunities.
In every case, it’s about making decisions faster and smarter.
Vadym:
Alright, Ievgen, this has been incredibly insightful. Ad hoc reporting is clearly a must-have for modern businesses.
Ievgen:
Absolutely. It’s all about empowering teams to act quickly, make informed decisions, and stay ahead in a competitive market.
Vadym:
Thanks for joining me today, Ievgen. And to our listeners, if you’re ready to take your reporting game to the next level, check out OWOX BI as a tool that make ad hoc reporting seamless and powerful. Go to owox DOT com and get started.
Also, make sure you subscribe to The Data Crunch Podcast for more insights on how to leverage data and reporting in your business. See you in the next episode!
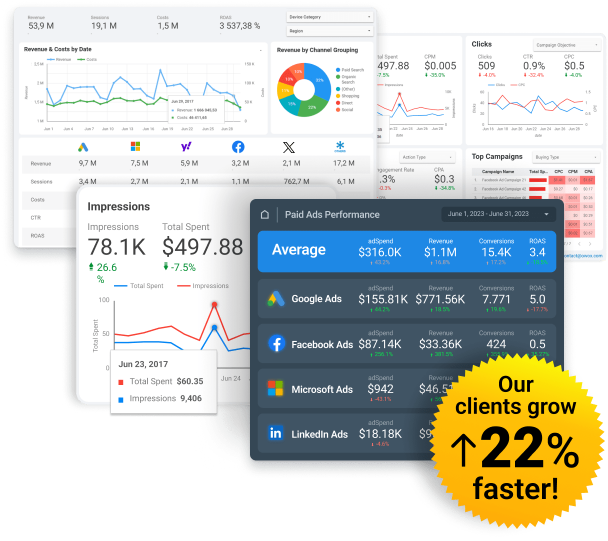
Gain clarity for better decisions without chaos
No switching between platforms. Get the reports you need to focus on campaign optimization
