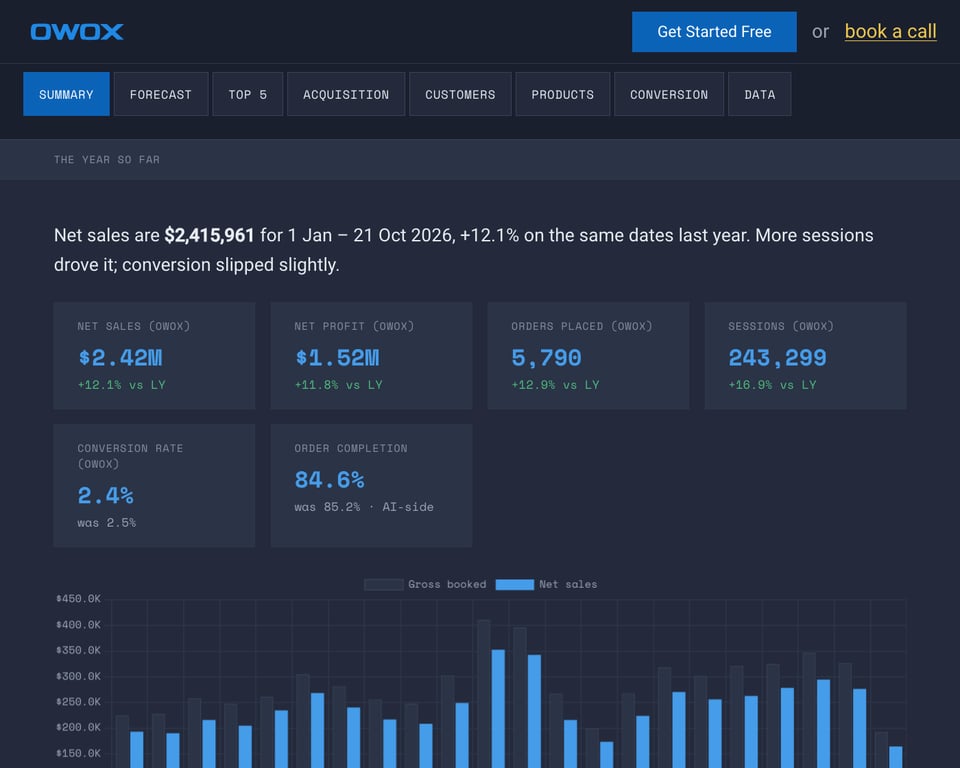
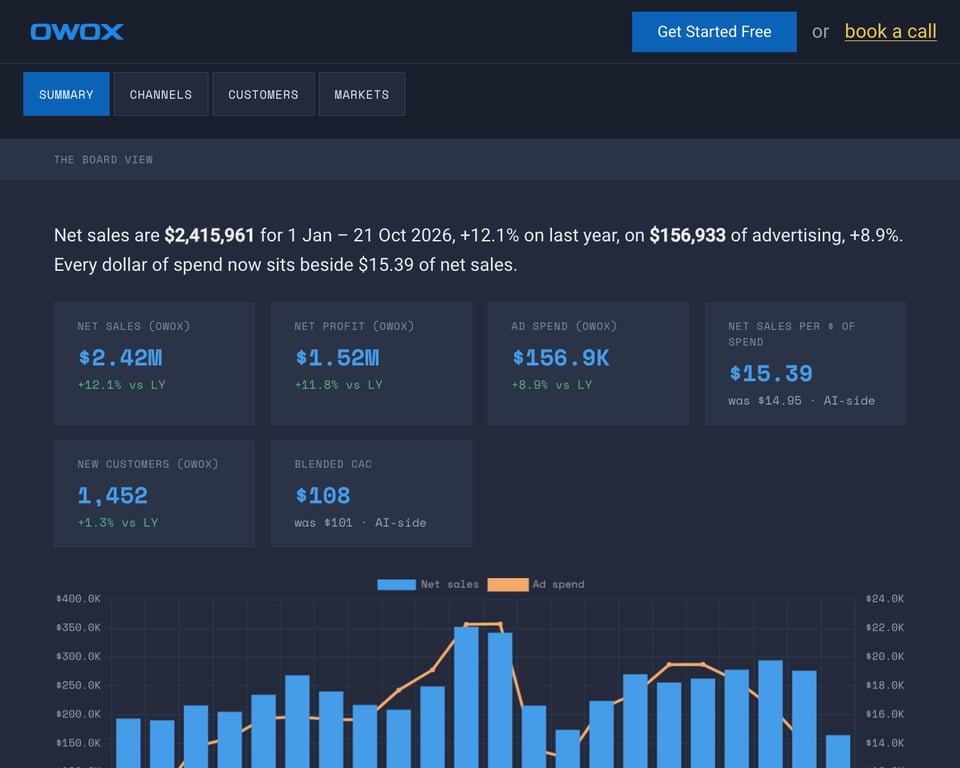
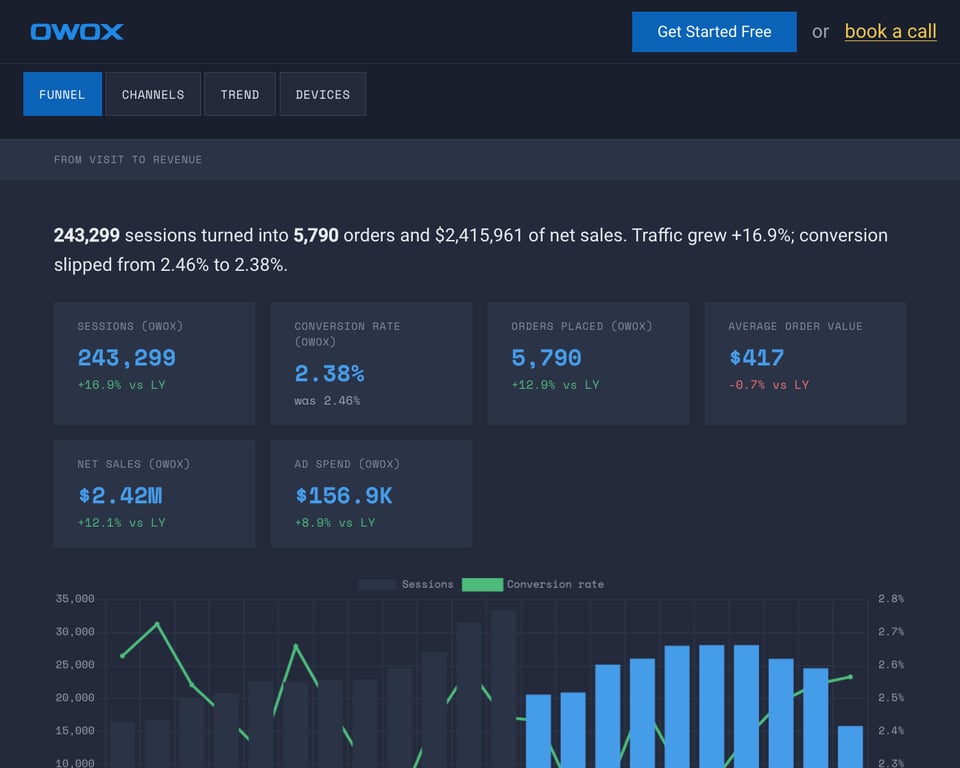
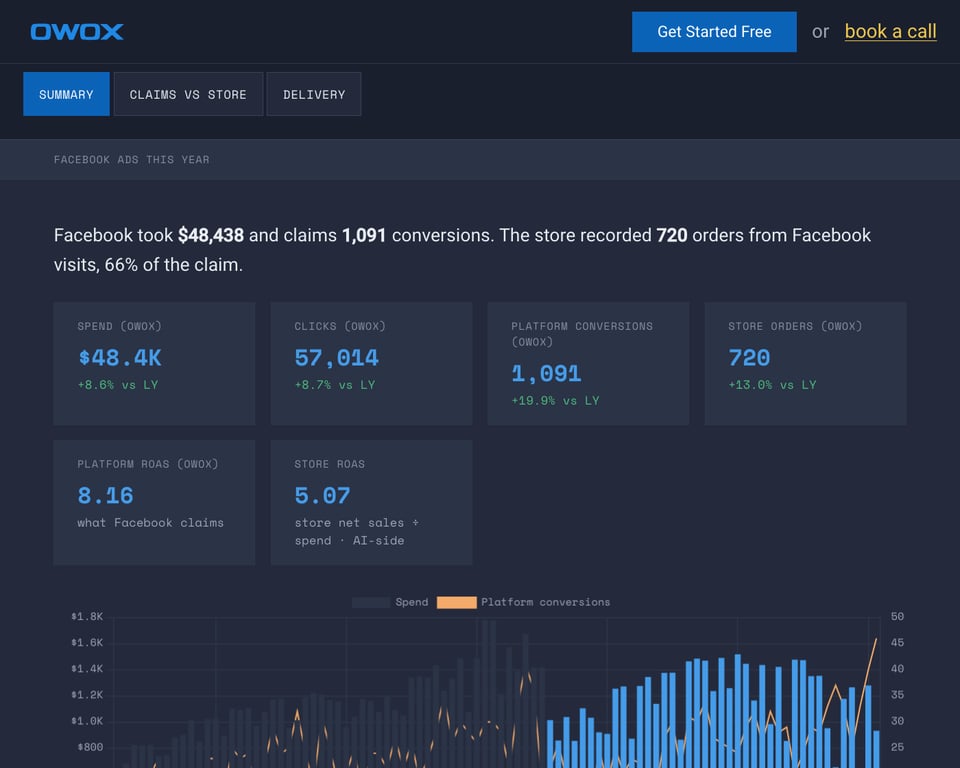
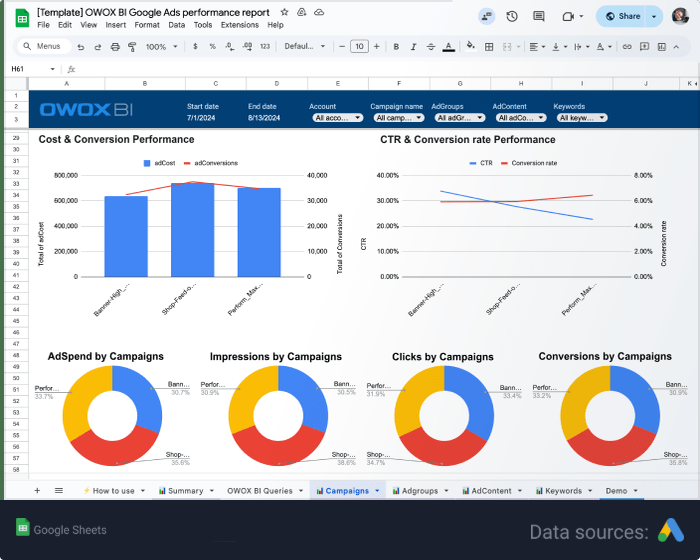
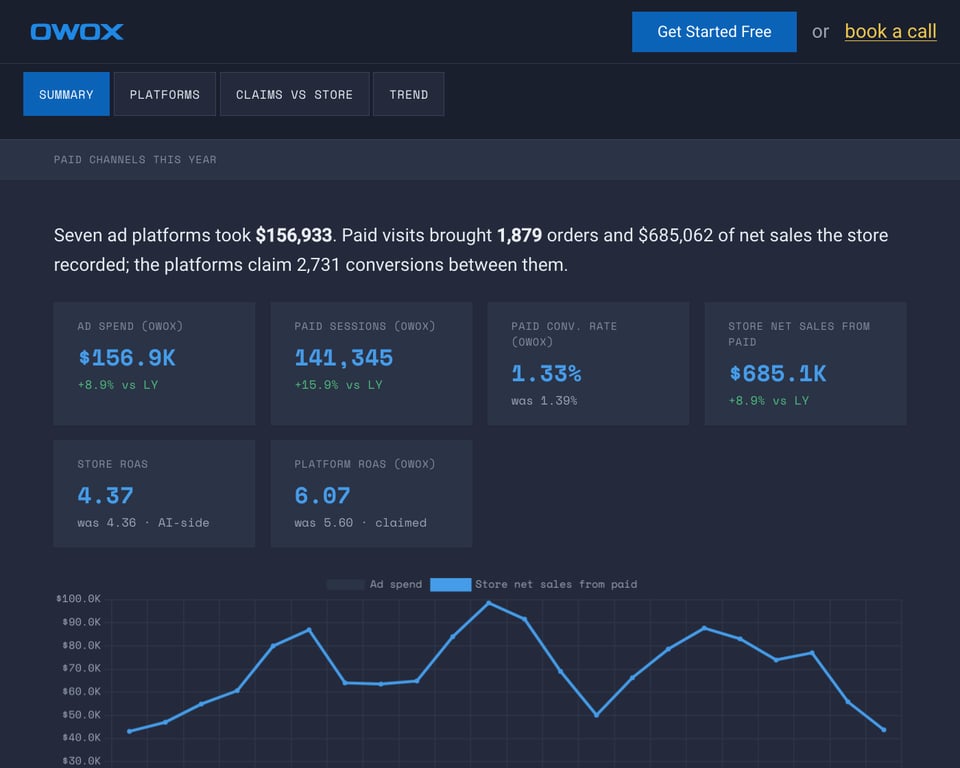
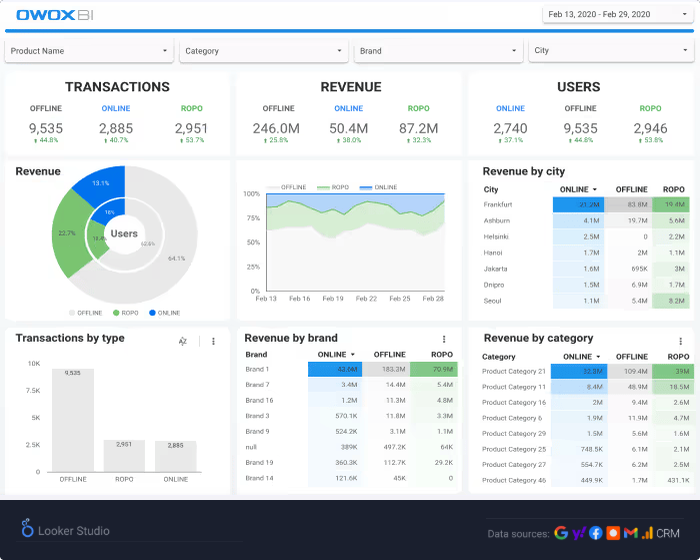
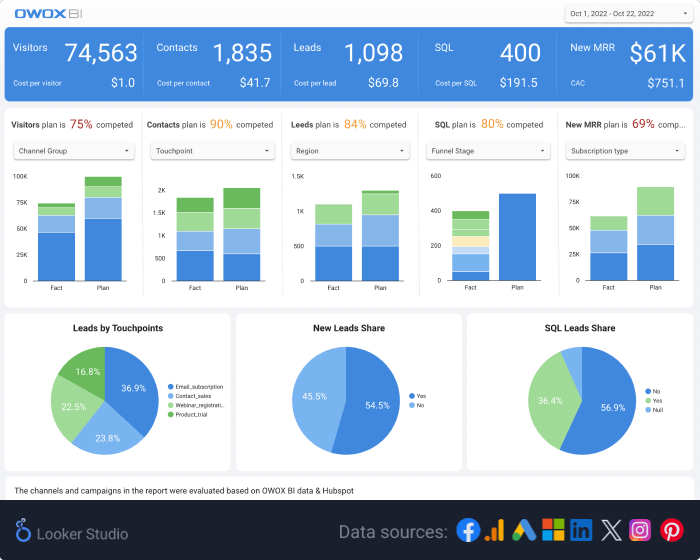
Analyze statistics from Google Ads, Facebook, and other advertising sources on one dashboard.


To compare the effectiveness of advertising channels, marketers have to switch between reports or manually summarize data in Excel and Google Sheets. This takes a lot of time and negatively affects the quality of data, and therefore decisions.
With OWOX BI, you don’t need to prepare data. You get a ready-to-update dashboard for all paid traffic sources.


Compare the profits, costs, displays and clicks, CTR, and ROAS of all traffic sources and draw conclusions about their payback.
Find out which sources work best, where you need to invest, and where you shouldn’t waste your budget.

Monitor key indicators daily to make operational decisions. Track the daily dynamics of revenue, expenses, clicks, and displays for each traffic source.
Find out what regions and cities your users come from.