
Top 25 Marketing KPIs and Digital Metrics to Measure in 2025
Get the insights you need to make data-driven decisions for your digital marketing campaigns with OWOX's expert advice on measuring KPIs.


Web analytics loses its meaning without a competent and timely analysis of key performance indicators (KPIs) and digital marketing metrics. We’ll go through a few interesting marketing formulas that will help you know your marketing flow better.
It’s hard to believe, but people may be wrong when assessing their everyday processes. According to DMA data, 39% of the metrics were limited to campaign delivery and digital vanity metrics rather than meaningful business outcomes.
More fundamentally, over a third of marketers (34.2%) say their company rarely or never measures the return on investment (ROI) of its marketing spend, highlighting a deeper gap in accountability.
.png)
Let’s take a look at some key marketing metrics and revisit them in a month. You might uncover insights about your practices that you’ve never noticed before. For instance, impressions, which represent the number of times your ad or organic content is displayed or viewed, can significantly boost brand awareness.
Selecting the right marketing metrics for your target audience is crucial for tracking progress toward your business objectives and maximizing the effectiveness of your campaigns.
Note:* This list of the most important and used internet marketing metrics and digital marketing KPIs was first published in 2018 and updated with new context in May 2025 to suit the current state of marketing analytics metrics and trends.
What are Marketing Metrics?
Marketing metrics are specific performance data points that marketers utilize to monitor, record, and measure the success of their marketing plans and campaigns over time.
Digital marketers rely on these marketing KPI metrics, including sales qualified leads, to optimize their strategies and improve campaign effectiveness. Selecting the right metrics that align with campaign goals is crucial, as these metrics can vary across different platforms.
Digital marketing metrics and KPIs (Key Performance Indicators) are ways to measure how well your online marketing efforts are working. Think of them like scorecards for your marketing strategies. Insights from these metrics help digital marketers allocate marketing budgets more effectively, ensuring resources are invested in the most impactful areas.
- Metrics are the specific data points you track, like website visits, social media followers, or email open rates.
- KPIs, on the other hand, are the most important metrics that tell you whether you’re achieving your marketing goals.
For example, if your goal for marketing channels is to increase sales, the key performance indicator (KPI) might be the number of online purchases. These metrics help you understand what’s effective and what needs improvement, so you can make better decisions and boost your online success.
What's the Difference Between Metrics and KPIs
The fundamental difference is that a metric is simply something you can count, like actions or events, for example, pressing the “Leave a message” button. A metric is just a number, and its interpretation is up to you. Each metric measures a specific aspect of marketing or sales performance, such as engagement or conversion, and these metrics help evaluate the efficiency and effectiveness of your marketing and sales efforts.
In contrast, a Key Performance Indicator (KPI) provides insights. Digital marketing KPIs usually have standard values and offer meaningful information about your business when you compare the actual value to the average. For instance, email marketing has typical open rates across different industries.
Marketing Qualified Leads (MQLs) and Sales Qualified Leads (SQLs) are examples of key marketing metrics and KPIs. MQLs are potential customers who have shown interest in a company’s offerings through marketing interactions, indicating their likelihood of converting. Additionally, engagement rate reflects how actively your audience interacts with your content on social media or other digital platforms, offering insights into content effectiveness.
Tracking MQLs helps assess the effectiveness of marketing teams, and their transition to Sales Qualified Leads, which are leads vetted and deemed likely to convert into customers, is crucial.
Why Are Marketing Metrics and Key Performance Indicators in Digital Marketing so Important?
You can’t say for sure if your business is performing well unless you look at the numbers. Marketing initiatives are crucial as they are measurable values that are assessed through various key performance indicators (KPIs) and marketing metrics, which help validate the effectiveness of marketing efforts to stakeholders.
Here are a few reasons why keeping an eye on these marketing key metrics and KPIs is so important.
- Measuring Performance: Metrics and KPIs provide a way to assess the effectiveness of your digital marketing efforts, helping you understand what’s working and what needs improvement. Tracking these metrics is also essential for evaluating marketing success, as they show whether your strategies are achieving their intended outcomes.
- Data-Informed Decision-Making: These metrics and digital marketing KPIs enable data-driven decision-making by providing actionable insights that guide resource allocation and strategy adjustments.
- Goal Tracking: Digital marketing key metrics help you track progress toward your marketing goals, ensuring that you’re on the right path to achieving them.
- ROI Assessment: These metrics allow you to determine if your marketing investments are delivering a positive return on investment, a crucial consideration for businesses.
- Continuous Improvement: Regularly monitoring metrics fosters a culture of continuous improvement, enabling you to optimize your marketing strategies over time for improved results.
Your focus should be on data that accurately reflects your digital marketing performance. Digital marketing requires tailored KPIs to measure their effectiveness across different channels, ensuring you capture the most relevant data for each effort.
Not sure what metrics you need and how to calculate them? We’ve prepared a selection of dashboards that will be useful to every marketer. Just select a template, connect your data, and get a ready-made report on advertising campaigns, sales funnel, ROPO, RFM, LTV, cohort analysis, and more.
List of 25 Marketing KPIs And Digital Metrics
What’s going on with my sales? Is my website effective enough? What’s been the efficiency of our content marketing efforts in the last few months? All of these questions can be answered by marketing and sales performance metrics and key performance indicators (KPIs).
1. Website Metrics
This digital marketing performance metric indicates the total number of visitors to your website over a specific period, providing an overview of your site’s reach and audience size. Tracking website traffic is crucial as it serves as a fundamental metric in digital marketing, including search engine optimization, helping to evaluate marketing effectiveness and guide strategic decisions.
Additionally, monitoring conversion metrics through analytics platforms is crucial for understanding how website visitors are converted into leads or customers.
Bounce Rate
Understanding bounce rate and exit rate is essential for analyzing user behavior on your website, though they measure different things. The bounce rate is calculated as the number of single-page visits (where a user views only one page) divided by the total number of visits. The formula is:

It's typically expressed as a percentage.
Average Session Duration
To calculate the average session duration, sum up the total time spent by all visitors on your website during a specific period and divide it by the total number of sessions. The formula is:

These formulas can be applied using web analytics tools like Google Analytics 4, which automatically tracks and calculates these metrics for your website.
2. Search Engine Optimization (SEO) Metrics
SEO metrics are one of the most crucial metrics in digital marketing for evaluating the performance of your website in search engine results and understanding how effectively your SEO efforts are driving organic traffic and improving your website’s authority.
- Organic Traffic: Organic traffic refers to the number of visitors who arrive at your website through unpaid (organic) search engine results. It indicates the visibility and relevance of your website in search engine rankings.
- Keyword Rankings: Keyword rankings track the position of your website’s pages in search engine results for specific keywords or phrases. Improved rankings for relevant keywords can lead to increased organic traffic. Higher positions on search engine results pages (SERPs) can significantly boost your website's visibility and potential for customer acquisition.
- Backlinks: Backlinks measure the number and quality of other websites linking to your site. High-quality backlinks from authoritative sources can enhance your website’s credibility and improve its search engine rankings.
- Engagement Rates: High engagement rates can lead to better organic reach on social media platforms, amplifying your content’s visibility and impact.
3. Domain Authority
Domain Authority is a marketing metric developed by Moz that assesses the overall authority and trustworthiness of your website in search engine algorithms. A higher Domain Authority score is generally associated with better search engine rankings.
4. Conversion Rate (CR)
Conversion rate is one of the simplest yet crucial digital marketing metrics. It represents the percentage of users who complete a desired action, such as making a purchase, downloading an app, or submitting a contact form. Many businesses use specialized apps to increase conversion rates by optimizing user experience, displaying targeted offers, and removing friction points in the buyer journey, turning more visitors into customers without necessarily increasing traffic.

You can find the number of conversions and total number of visitors in Google Analytics 4.'
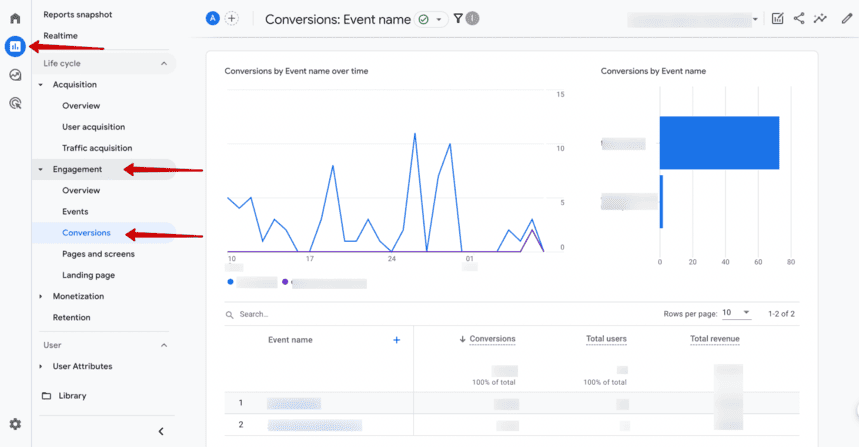
Once you've set your goals, you can see this visualization on the Reports —> Engagement —> Conversion page.
5. Click-Through Rate (CTR)
Clicks can often lead to purchases. The click-through rate (CTR) measures the percentage of users who click on a link compared to the total number of users who see it.

For instance, in a Google Ads campaign, if your ad is displayed 1,000 times and receives 100 clicks, your CTR would be 10%. This means that 10% of the users who saw your ad took the desired action of clicking on it.
A high CTR indicates that your ad is resonating with your target audience, driving more traffic to your website, and is a valuable KPI to monitor for optimizing ad campaigns to achieve better performance.
6. Cost per Click (CPC)
Cost per click (CPC) is a key performance metric in digital marketing that indicates whether you can save money on paid ads. It measures how much you pay each time your ad is clicked, relative to your ad spend, helping you assess the cost-effectiveness of your ad campaign.

Google Ads provides this information when calculating the CPC for your keyword auctions. You can seamlessly integrate your Google Ads with Google Analytics 4 (GA4) and further connect other ad services using OWOX Data Mart.
7. Cost per Action (CPA)
Cost per action (CPA) is a digital advertising metric that reflects the cost of achieving a specific desired action. It also helps evaluate the effectiveness of your marketing funnel. The desired action is defined by you, it could be anything from signing up for a newsletter to requesting a callback or any other marketing funnel goal you set.

This straightforward metric forms the foundation of CPA marketing, where you pay for each conversion generated by an affiliate. However, a potential drawback of this approach is that unethical affiliates may attempt to deceive you with fake traffic.
8. Cost per Lead (CPL)
This KPI is even more critical than the previous one! Cost per lead (CPL) is similar to cost per action, but instead of paying for a specific action, you pay for the contact information of a marketing-qualified lead—someone who is potentially interested in your offer.

To calculate CPL, sum up all your ad expenses leading to actions like gated content registrations, then divide the total by the number of leads acquired. This will help you determine whether your cost-per-lead acquisition efforts are within budget or if you're overspending. Remember, a marketing-qualified lead is only halfway to becoming a client and hasn't yet become a loyal follower.


9. Customer Acquisition Cost (CAC)
Customer Acquisition Cost (CAC) is a vital digital advertising performance metric that calculates the average cost a business incurs to acquire a new customer. It provides insights into the efficiency and sustainability of marketing and sales strategies.
The marketing team plays a crucial role in managing customer acquisition costs (CAC) by tracking key performance indicators (KPIs) and maintaining effective communication to enhance decision-making and overall performance metrics.

To calculate CAC, you add up all the costs associated with acquiring customers, including marketing expenses, advertising costs, and sales team salaries, and then divide that total by the number of new customers acquired during a specific period.
For example, if you spent $10,000 on marketing and sales efforts in a month and acquired 100 new paying customers, your CAC would be $100.

Monitoring CAC helps businesses understand the financial viability of their customer acquisition strategies. A lower CAC is generally more desirable, as it means you are acquiring customers at a lower cost, potentially leading to better profitability. However, what constitutes a “good” CAC for one business may not be the same for another.
Monitoring CAC helps businesses understand the financial viability of their customer acquisition strategies. A lower CAC is generally more desirable, as it indicates that you are acquiring customers at a lower cost, which can potentially lead to improved profitability. However, what constitutes a “good” CAC for one business may not be the same for another.
10. Email Marketing Metrics: Open Rate and Click Rate
Email marketing metrics, such as open and click rates, indicate how well your emails perform. The open rate reflects the appeal of the subject line and timing, while the click rate reveals content engagement. Tracking these helps refine messaging, increase engagement, and improve future campaign results, making them essential KPIs for email marketers, e-commerce teams, and digital strategists.
11. Pay-Per-Click (PPC) Metrics: Impressions, Clicks, Conversions
PPC metrics measure ad performance through impressions, clicks, and conversions. Impressions indicate how often your ad is displayed, clicks reveal interaction, and conversions track actions such as purchases or form fills. These indicators help evaluate ad effectiveness and budget use, making them vital for marketers focused on paid search, display, or retargeting strategies.
12. Abandonment Rate
This metric represents the percentage of inbound calls that are disconnected before reaching a call center agent, or the percentage of abandoned shopping carts in the retail industry.
For call centers:

For retail businesses or e-commerce:

A high abandonment rate can be a concern for online retailers, as it indicates that a significant portion of potential customers are leaving the purchase process without converting
13. Return on Ad Spend (ROAS)
Clear and straightforward, Return on Ad Spend (ROAS) is one of the most crucial metrics for measuring ad performance in digital marketing. Return on Ad Spend (ROAS) represents the revenue your business earns for every dollar spent on advertising campaigns.
By using ROAS as the primary metric for each digital marketing campaign, you'll be able to distinguish between effective marketing spend and less successful efforts.

14. ROI (ROMI for marketing campaign)
ROI is the crown jewel of KPIs in digital marketing, even recognized by those unfamiliar with analytics! Return on investment is a performance metric used to assess the effectiveness of a specific investment.

You can calculate ROI for nearly any process. Typically, ROI is standardized and should be above 100%. Before starting your calculations, ensure that you find benchmarks relevant to your specific situation. Monitoring ROI is crucial for justifying marketing expenditures to stakeholders. For more details, check out our article on ROI.
15. Average Revenue Per Account/User/Customer (ARPA, ARPU, ARPC)
Average Revenue Per Account/User/Customer (ARPA, ARPU, or ARPC) is a key financial metric used to measure the average revenue generated by each account, user, or customer over a specified period, typically on a monthly or annual basis.
This metric is particularly important for subscription-based businesses, software-as-a-service (SaaS) companies, and other subscription models, as it helps assess the financial health and sustainability of the customer base.
Average revenue per account (or per user or customer) shows you the average revenue from an account.

Before raising prices, monitor your ARPA (Average Revenue Per Account). Check it again afterward. If the price increase was a mistake, it will be reflected in a lower ARPA — unless your total monthly recurring revenue rises, the ARPA will decline.
16. Time to Payback CAC
This financial metric indicates how long it will take to recoup the marketing costs spent on acquiring a customer. The time to payback CAC is especially crucial for subscription-based businesses and those with recurring revenue models, making it particularly relevant for SaaS companies with long sales funnels.

Monitoring Time to Payback CAC is crucial because it helps businesses assess the efficiency of their customer acquisition strategies and the sustainability of their revenue streams. A shorter payback period indicates a faster return on investment and a more efficient customer acquisition cost, which can be vital for business growth and financial stability.
17. Monthly Recurring Revenue (MRR)
MRR, or Monthly Recurring Revenue, is a key metric for the recurring revenue components of a subscription-based business. It helps companies forecast revenue and adjust their sales strategies accordingly.

MRR, as a KPI, is often more closely associated with the customer journey than with finance. Still, marketing and sales contribute to MRR growth by acquiring new customers and retaining existing ones. Engaging existing customers is crucial for increasing long-term revenue and improving retention metrics.
18. Churn Rate
The churn rate is the percentage of customers or subscribers who discontinue their subscriptions during a given period.

Churn metrics are vital for understanding customer retention and identifying where marketing, social media engagement, and sales efforts may need improvement to reduce customer attrition.
19. Social Media Engagement Metrics: Likes, Shares, Comments
Social media engagement metrics, likes, shares, and comments, reflect how audiences interact with your content. High engagement means your posts resonate, encouraging more visibility and reach through platform algorithms. These metrics are crucial for shaping content strategies and understanding what drives interaction, making them essential for social media teams and digital brand managers.
20. Revenue-churn
Also referred to as the MRR churn rate, where MRR stands for Monthly Recurring Revenue, revenue churn measures the loss of revenue due to customers canceling or downgrading their subscriptions.

21. Share of Market (SOM)
This metric evaluates the company's market presence in relation to its competitors. While marketing often plays a significant role in market share growth, sales strategies can also influence it.
This metric indicates your market share.

You can calculate the percentage of the market's sales you capture and set appropriate growth goals. The main challenge lies in obtaining comprehensive data on overall market sales.
22. Share of Wallet (SOW)
Share of Wallet is a digital marketing measurement KPI that shows the portion of a customer's spending going to your company compared to competitors. Both marketing and sales can impact this metric by providing value and retaining customers. You can get this data through marketing investigations or focus groups.

Suppose Ann spent $20 on your handmade cosmetics this month, out of a total of $120 spent on cosmetics overall. Your Share of Wallet (SOW) would be 20/120 × 100% = 16.6%. Not quite as high as anticipated!
23. Customer Retention Rate (CRR)
How long do customers continue to return to your business, or do they make a purchase and then move on? Acquiring new customers is far more costly than re-engaging existing ones. The customer retention rate, also known as reverse churn, reflects this ongoing relationship.

A perfect customer retention rate is 100%, indicating strong customer loyalty and long-term engagement. However, if you notice a decline, it's important to focus more on your customer service. Maintaining a high retention rate is crucial for the success of your marketing initiatives and your overall digital marketing strategy.
24. Customer Lifetime Value (CLV)
Customer lifetime value can be either historical, representing the total profits from all purchases a customer has made, or predictive, estimating the total revenue your business anticipates from the ongoing relationship with that customer.

LTV (also known as customer lifetime value) is a crucial metric that guides marketing and sales efforts, enabling businesses to make informed decisions about customer acquisition, retention, the customer journey, and customer loyalty programs.
It emphasizes the importance of fostering long-term customer relationships for sustained revenue growth. Monitoring customer lifetime value (CLV) is particularly important in this context, as it provides a comprehensive view of the value each customer brings over time.
25. Net Promoter Score (NPS)
Net Promoter Score is a widely used customer satisfaction metric that measures how likely customers are to recommend your brand, product, or service to others. It’s based on responses to a single question: “On a scale of 0–10, how likely are you to recommend us?” Customers are grouped into promoters (9–10), passives (7–8), and detractors (0–6).
NPS is a powerful indicator of brand loyalty and overall marketing success, often correlating with retention and revenue growth. Regularly tracking your NPS can help you identify areas for advocacy potential and opportunities for improvement in the customer experience.

Over the Waterfall of Metrics in Digital Marketing
The metrics and KPIs mentioned in this article are just the surface of what you can measure in digital marketing. However, understanding these online marketing metrics is essential to avoid being caught off guard, much like the crew of the Titanic, when you encounter challenges in the vast ocean of business.
Analyze your marketing efficiency, identify areas for improvement, and increase your return on investment (ROI). Conversion Rate Optimization (CRO) focuses on enhancing website design and user experience to increase conversions, ensuring that your marketing efforts yield tangible results.
Yes, it's a lot of metrics and KPIs to measure, and managing multiple dashboards can be overwhelming. At OWOX Data Mart, you can integrate all your marketing efforts in one place and look at the important digital marketing metrics and KPIs in one dashboard.
Frequently asked questions


Finally, a tool that doesn't ask business users to learn a new dashboarding UI. Our marketing team already knows Sheets. OWOX just delivers the right data.
Joinable data marts concept was the thing that sold us. We can now use the semantic layer without building one.
Self-hosted the OSS version on Digital Ocean. Zero vendor lock-in. Contributed a Shopify connector back in week two.