
Who is responsible for data quality? Responsibility matrix for analytics teams
Manage data quality effectively. Learn who's responsible for data quality at each stage in a company and ensure accurate and informed decisions.

.png)
Since poor quality data can make any further actions useless (such as calculating attribution, sending bids to advertising services, or building reports), assuring the quality of data continues to be the biggest challenge in digital analytics. It’s common to say that analysts are responsible for all data-related issues. But is this true?
Who is responsible for data quality in a company? Contrary to popular belief, it’s not only the analysts. For example, marketers work with UTM tags, engineers apply tracking codes, etc. So it’s no surprise that chaos occurs when working with data: each employee has many tasks, and it isn’t clear who’s doing what, who’s responsible for what, and who should be asked for the result.
In this article, we try to understand who is responsible for data quality at each stage and how to manage it.
Data workflow
Even within one company, the world of data can be filled with discrepancies and misunderstandings. To empower business users with quality data and avoid missing valuable data, you need to plan the collection of all necessary marketing data. By preparing the data workflow, you demonstrate how data is related for colleagues in all departments so it becomes easy to connect the dots. However, that’s only the first step. Let’s see what the other steps are in preparing data for reports and dashboards:
- Set up primary data collection.
- Collect raw data into data storage or a database.
- Turn the raw data into business-ready data, with markup, that’s cleaned up and in a structure that’s understandable to the business.
- Prepare a data mart — a flat structure that serves as a data source for visualizing data.
- Visualize data for the dashboard.

Yet, regardless of all preparation, decision-makers often encounter a report or dashboard with poor quality data. And the first thing they do is turn to the analyst with the question: Why is there a discrepancy? or Is the data relevant here?
However, the reality is that different specialists are involved in these processes: data engineers are engaged in setting up the analytics system, marketers add UTM tags, users enter data. Let’s see in detail what stages you should go through and how they should be implemented to provide users with high-quality data.
1. Collecting primary data
Though this step looks like the easiest, there are several hidden obstacles. First of all, you have to plan to collect all data from all sources, factoring in all customer touchpoints. Sometimes this planning step is skipped, but doing so is unreasonable and risky. Taking an unstructured approach leads to getting incomplete or incorrect data.
The main challenge is that you have to collect fragmented data from different advertising platforms and services you work with. Since processing massive data arrays in the shortest possible time is complicated and resource-intensive, let’s see what possible bottlenecks can appear:
- Not all pages have a GTM container installed, and therefore data isn’t sent to Google Analytics.
- A new account on an advertising platform is created, but analysts aren’t informed and data isn’t collected from it.
- An API doesn’t support dynamic parameters in UTM tags and doesn’t collect or transfer them.
- The card connected to the Google Cloud project has insufficient funds or credit.
- Incorrect validation of data entered by a user.
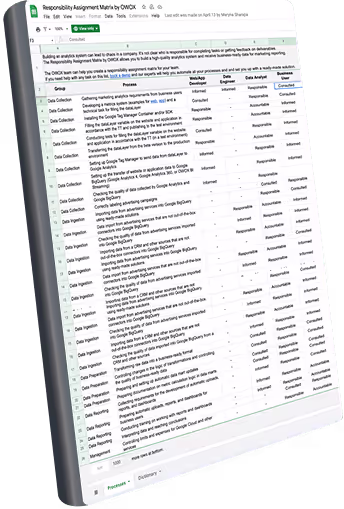
During this step, among all other challenges, you have to consider controlling access to data. For this, we recommend using the classic RACI matrix that defines roles for processes and emphasizes who does, controls, manages, and is responsible for what. Here are the possible roles:
- R (Responsible) — someone who is responsible for and is the executor of a particular process
- C (Consulted) — a person who consults and provides necessary data to implement the process
- A (Accountable or Approver) — someone who is responsible for the result of the work
- I (Informed) — a person who must be informed of the progress of the work
According to the RACI matrix, the roles and responsibilities for data collection look like this:

2. Importing data into the data warehouse
The next step is to decide where to store all obtained data. If you want to gain complete control over your raw data without modifying it, we recommend using a single storage with automated data import. As using your own servers for storing every byte of data will cost a fortune, we recommend using cloud solutions that save your resources and provide access to data everywhere.
The best option for this task is Google BigQuery, as it considers the needs of marketers and can be used for storing raw data from websites, CRM systems, advertising platforms, etc. Today, there are tons of marketing software solutions. We recommend OWOX BI, which automatically collects data into a data warehouse (or data lake) from different services and websites.
Let’s see what classic errors can occur when collecting raw data:
- The API of the advertising service has changed. Accordingly, the data format also has changed.
- The external service API isn’t available. The stakeholder sees certain numbers in their personal account, but the API of the same advertising service gives other data. This data doesn’t match because, like in any distributed system, the data source for the advertising service API is different from the data source for the web portal.
- Data in the external service’s web interface and API is different. Documentation and data processing formats can be different. For example, an interesting mistake in one of the popular advertising services is that expenses are zero both when they don’t exist and when they are actually zero. All data engineers and analysts know that zero and Null are different values and are processed differently. In one case, these expenses may appear and must be requested again, and zero means that they really aren’t there and are counted as zero.
- The API of an external service provides incorrect data.
According to the matrix, in this process, the marketer is a consultant and source of knowledge: for example, knowledge about what accounts you need to download data from, what the UTM tags are, and markup on advertising campaigns.

There are also developers who want to know what changes would happen to containers if Google Tag Manager were used, as they are responsible for the website’s download speed.
At this point, data engineers are already performing the responsible role because they are configuring data pipelines. And analysts are responsible for the result of the work. Even if one employee performs these functions, there will actually be two roles. So if the company has only one analyst, we still recommend implementing the matrix by roles. Then, with the growth of the company, you’ll have a job description for a new colleague, and it will be clear what the responsibilities are for a specific role.
The stakeholder at this stage is interested in knowing what data is available and what problems there are with its quality, as it identifies priorities and resources aimed at collecting data. For example, the OWOX BI Data Monitoring feature is widely applied by our clients.

3. Preparing the SQL view
Data preparation is the next step. It’s often called data mart preparation — this is a flat structure containing those parameters and metrics that will be presented on the dashboard. An analyst who is limited in tools, budget, and time often skips the stage of preparing business data and immediately prepares a data mart. It looks like raw data collected in a data warehouse. Then, there are a million different SQL queries along with Python and R scripts — and this mess will result in something on the dashboard.
If you keep skipping the preparation of business-ready data, it will lead to repeated errors that need to be corrected in each of the sources. Other things that could go wrong include:
- Regular errors in primary data
- Business logic being duplicated in all SQL queries
- Lots of time required to find the causes of data discrepancies
- Time to refine existing data marts being comparable to time for rewriting a request
- Report logic being incomprehensible to the customer
The simplest and most common example of a mistake is the definition of a new user and returned user. Most businesses don’t make this distinction in the same way as Google Analytics. Therefore, the logic of user type definitions is often duplicated in different reports. Frequent errors also include incomprehensible report logic. The first thing the business customer will ask about when looking at the report is how it was built, what assumptions it was based on, why the data was used, and so on. Therefore, the preparation of business data is a stage you definitely shouldn’t skip. Building a data mart from raw data is like not washing vegetables and fruits before eating them.
If we assign responsibilities according to the matrix, then for data preparation, we’ll get this:

4. Preparing business-ready data
Business-ready data is a cleaned final dataset that corresponds to the business model. It’s ready-made data that can be sent to any data visualization service (Power BI, Tableau, Google Data Studio, etc.).
Naturally, different businesses operate with different models. For example, the definitions of “users,” “B2B users,” “transactions, “leads,” etc. will mean different things for different companies. These business objects actually answer the question of how a business thinks about its business model in terms of data. This is a description of the business at its core and not the structure of events in Google Analytics.
The data model allows all employees to synchronize and have a general understanding of how data is used and what is understood about it. Therefore, converting raw data to business-ready data is an important stage that cannot be skipped.
What could go wrong at this stage:
- Not clear which data model the company has/uses
- Difficult to prepare and maintain simulated data
- Difficult to control changes in transformation logic
Here, you need to decide which data model to choose and how to control changes in the logic of data transformation. Accordingly, these are the roles of participants in the change process:

The stakeholder is no longer just informed but becomes a consultant. They make decisions like what should be understood as a new or returned user. The task of the analyst at this stage is to involve stakeholders as much as possible in making these decisions. Otherwise, the best thing that can happen is that the analyst will be asked to redo the report.
In our experience, some companies still don’t prepare business-ready data and build reports on raw data. The main problem with this approach is endless debugging and rewriting of SQL queries. In the long run, it’s cheaper and easier to work with prepared data instead of running around raw data doing the same things again and again.
OWOX BI automatically collects raw data from different sources and converts it into a report-friendly format. As a result, you receive ready-made datasets that are automatically transformed into the desired structure, taking into account nuances important for marketers. You won’t have to spend time developing and supporting complex transformations, delve into the data structure, and spend hours looking for the causes of discrepancies.
5. Preparing the data mart
The next stage is preparing the data mart. Simply put, this is a prepared table containing the exact data needed by certain users of a particular department, which makes it much easier to apply.
Why do analysts need a data mart, and why should you not skip this stage? Marketers and other employees without analytical skills find it difficult to work with raw data. The task of the analyst is to provide all employees with access to data in the most convenient form so they don’t have to write complex SQL queries every time.
A data mart helps solve this problem. Indeed, with a competent filling, it will include exactly the data slice necessary for the work of a certain department. And colleagues will know exactly how to use such a database and will understand the context of the parameters and metrics presented in it.
The main cases in which something can go wrong when preparing the data mart are:
- Data merge logic is incomprehensible. For example, there may be data from a mobile application and website, and you need to decide how to merge it and by which keys, or decide how to merge ad campaigns with activities in a mobile app. There are a lot of questions. By making these decisions when preparing business data, we make them once and their value is greater than those decisions made ad-hoc for a specific report here and now. Such ad-hoc decisions must be made repeatedly.
- An SQL query doesn’t run due to data warehouse technical limitations. Preparing business data is one way to clean up data and bring it into a simulated structure that will make it cheaper to process and speed up queries.
- It isn't clear how to check data quality.
Let’s see who is responsible for what at this stage according to the matrix:

It’s obvious that data preparation is the responsibility of data analysts along with stakeholders and data engineers, who are consultants in the process. Note that OWOX BI analysts can handle this task for you. We can collect and merge data, model it for your business model, and prepare a data mart accompanied by detailed instructions with a description of the build logic, allowing you to make changes on your side if necessary (for example, adding new fields).

6. Visualizing data
Visually presenting data in reports and dashboards is the final stage for which everything was actually started. Obviously, data should be presented in a way that is both informative and user-friendly. Not to mention that automated and properly configured visualizations significantly reduce the time to find risk zones, problems, and growth possibilities.
If you have prepared business-ready data and a data mart, you will have no difficulties with visualizations. However, there also can appear mistakes such as:
- Irrelevant data in the data mart. If a business isn’t sure about data quality, then even if the data is of high quality, the first step is for the business customer to ask the analyst to double-check everything. This is inefficient. It’s clear that the business wants to be protected from mistakes and not rush to conclusions. Therefore, the high quality of data is a guarantee that someone will use it later.
- Choosing an incorrect data visualization method.
- Not properly explaining to the customer the logic of metric and parameter calculations. Often, for a business customer who doesn’t live in SQL and metrics to correctly interpret the data, they need to see what each metric means in the context of the report, how it’s calculated, and why. Analysts shouldn’t forget that anyone who uses the report should have access to an explanation of what’s behind the report, what assumptions were at the heart of the report, etc.
According to the RACI matrix, the analyst already has a dual role — approver and responsible. The stakeholder is a consultant here, and most likely they have answered in advance the question of what decisions they plan to make and what hypotheses they want to test. These hypotheses form the basis for the design of the visualization with which the analyst works.

Key takeaways
The RACI matrix isn’t an answer to all possible questions about working with data, but it definitely can ease the implementation and application of the data flow in your company.
Since people in different roles are involved in different stages of the data flow, it’s wrong to assume that the analyst is solely responsible for data quality. Data quality is also the responsibility of all colleagues who are involved in data markup, delivery, preparation, or management decisions.
All data is always poor quality, and it’s impossible to permanently get rid of data discrepancies, make data consistent, and rid it of noise and duplication. This always happens, especially in such a fast and dynamically changing data reality as marketing. However, you can proactively identify these problems and set a goal to make your data quality known. For example, you can obtain answers to questions such as: When has the data been updated? In what granularity is data available? What errors in the data do we know about? and What metrics can we work with?
For those who want to contribute to improving their company’s data quality, we recommend three simple steps:
- Create a data flow schema. For example, use Miro and sketch how your company uses data. You’ll be surprised how many different opinions there are about this schema within one company.
- Put together a responsibility matrix and agree on who is responsible for what, at least on paper.
- Describe the business data model.
Useful links
- Dark Data: Why What You Don’t Know Matters by David J. Hand
- The Signal and the Noise: Why So Many Predictions Fail--but Some Don’t by Nate Silver
- Predictably Irrational by Dr. Dan Ariely
- The Irrational Ape: Why We Fall for Disinformation, Conspiracy Theory, and Propaganda by David Robert Grimes
- An experience of a “Data Ecosystem” by Antriksh Goel
Frequently asked questions


.png)


Finally, a tool that doesn't ask business users to learn a new dashboarding UI. Our marketing team already knows Sheets. OWOX just delivers the right data.
Joinable data marts concept was the thing that sold us. We can now use the semantic layer without building one.
Self-hosted the OSS version on Digital Ocean. Zero vendor lock-in. Contributed a Shopify connector back in week two.