All resources
Every successful business decision relies on well-structured data. Dimensional data modeling provides a structured approach to organizing data, making it easier to retrieve, analyze, and report.
By categorizing data into facts and dimensions, this technique enhances query performance and simplifies complex datasets, ultimately supporting efficient business intelligence.

This guide covers the key concepts, techniques, and best practices of dimensional data modeling. With a well-designed model, businesses can enhance data accessibility and support scalable analytics.
A dimensional data model is a structured approach used in data warehouses to organize and store data efficiently. It categorizes data into fact tables (which contain measurable business metrics) and dimension tables (which provide descriptive context). This design helps optimize databases for faster query performance, making it easier to retrieve and analyze large datasets.
By structuring data this way, businesses can eliminate redundancy and enhance reporting accuracy. For example, in an e-commerce system, dimensions like products, customers, and order items help provide context for fact tables that store sales transactions, enabling deeper analysis of trends and performance.
Dimensional modeling consists of key components that structure data for efficient analysis. These include facts, dimensions, fact tables, dimension tables, and attributes, each playing a crucial role in organizing and optimizing data.
Dimensions provide descriptive details about who or what is involved in a business event, adding context to fact tables. They categorize data into entities like users, accounts, and products and remain consistent even when actions change. Instead of creating duplicate entries, updates overwrite existing data.
For example, in e-commerce, a product catalog acts as a dimension, storing attributes like product name, category, brand, and price for sales analysis.
Common types include:
These dimensions ensure flexibility, improve query performance, and support better data analysis.
Facts represent measurable business events, actions, or results. They capture activities like orders placed, products purchased, or revenue generated and serve as a historical record. Instead of overwriting existing data, new records are continuously added to ensure accuracy over time.
For example, in an e-commerce business, a fact table like fct_sales tracks each product sold in an order, helping businesses analyze sales performance, product demand, and revenue trends.
A fact table stores core business measurements, representing the smallest unit of a business process. It records measurable events like orders, payments, or interactions while preserving historical data.
For instance, in an e-commerce business, a fact table like fct_sales can track daily sales transactions, storing details such as order ID, product ID, customer ID, quantity sold, total price, and order date.
Below is an example of how a fact table might look for an e-commerce business:
Dimension tables store descriptive attributes that provide context to facts, answering who, what, when, and where. Each entity, such as a product or order, is represented by a single row with attributes like name, category, and status. If an update is needed, values are overwritten rather than adding new rows to maintain consistency.
For instance, in an e-commerce business, a dimension table like dim_products can track product details, ensuring a structured and uniform dataset.
Below is an example of how a product dimension table might look for an e-commerce business:
Attributes are the defining characteristics of a dimension table, providing descriptive details about data. They help categorize and filter information for analysis. For example, in a customer dimension, attributes might include first name, last name, and phone number. These details enhance reporting by allowing businesses to segment and analyze data effectively.
Dimensions help categorize and describe data in a warehouse. Various types, such as conformed, role-playing, and slowly changing dimensions, ensure accurate analysis, better organization, and improved data consistency across different business processes.
Standardizing attributes across multiple database tables, conformed dimensions ensure consistency in reporting and analysis. They maintain uniform structure, definitions, and key values, allowing different tables to maintain a uniform reference.
Whether identical or a subset of a more detailed dimension, conformed dimensions help businesses analyze related data across various processes, such as sales and inventory, without discrepancies.
Dimension tables usually don’t reference other dimensions with foreign keys. When they do, the referenced table is an outrigger dimension, often considered a data warehouse anti-pattern due to its impact on query performance. A better approach is to use fact tables to manage relationships between dimensions, ensuring a more efficient design. While sometimes necessary, outrigger dimensions are best avoided.
A shrunken dimension is a smaller version of a conformed dimension, keeping only selected rows, columns, or both. It’s useful in aggregated fact tables, where summarized data is enough, helping improve performance while ensuring consistency. Common in reporting, it gives a more focused view of key business metrics, making analysis more efficient.
Reusing the same dimension table for different purposes within a database is known as a role-playing dimension. A Date dimension, for example, can represent the Date of Sale, the Date of Delivery, or the Date of Hire. Instead of creating separate tables, this is often managed using database views, ensuring consistency, reducing redundancy, and improving query efficiency across different business processes.
Connecting one dimension table to another through joins creates a dimension-to-dimension table relationship. These relationships are often modeled using outrigger dimensions, where one dimension references another.
While this method can sometimes be useful, it is generally discouraged in dimensional modeling to keep structures simple and ensure better query performance in a data warehouse.
A junk dimension groups low-cardinality attributes like flags, indicators, and extra comments into one table. These details don’t fit in the existing dimension tables and are often left after defining key dimensions. Storing them separately keeps the fact table simpler, improves query performance, and helps maintain a clean and scalable data model.
Degenerate dimensions store keys like transaction numbers, invoice numbers, or ticket numbers that have no associated attributes. These keys exist in the fact table but do not link to a separate dimension table. Common in transaction-level fact tables, degenerate dimensions help uniquely identify records, support indexing, and improve query performance without requiring an additional dimension table.
Swappable dimensions allow a fact table to be linked with multiple versions of the same dimension, each tailored for different users or contexts. For example, stock ticker quotes can be exposed to different investors, with each having unique proprietary attributes. This approach enables flexible reporting, personalized data views, and efficient dimension management without modifying the fact table structure.
Step dimensions represent sequential processes, where each step is recorded as a separate row in the fact table. These dimensions help track the progression of a session or workflow, showing how each step fits into the overall process. Commonly used in workflow automation and procedural tracking, step dimensions provide detailed insights for optimizing multi-step business operations and performance analysis.
Different design patterns in dimensional data modeling help structure data efficiently for analysis and reporting. Common approaches include star schema, snowflake schema, and fact constellation schema, each offering unique advantages based on business needs.
The star schema is a simple and efficient way to organize data for analysis. Developed as part of Kimball’s approach to dimensional modeling, it structures data with a fact table at the center, linked to multiple dimension tables. The fact table stores business metrics, while dimension tables provide descriptive details.
This design minimizes complex joins, improving query performance and making data retrieval faster. The name "star schema" comes from the way dimension tables surround the fact table, forming a star-like structure. It is widely used in data warehousing for its ease of use and scalability.

💡 Want to learn in-depth about Star schema? Dive deep into how star schema works, its advantages, and when to use it for efficient data management.
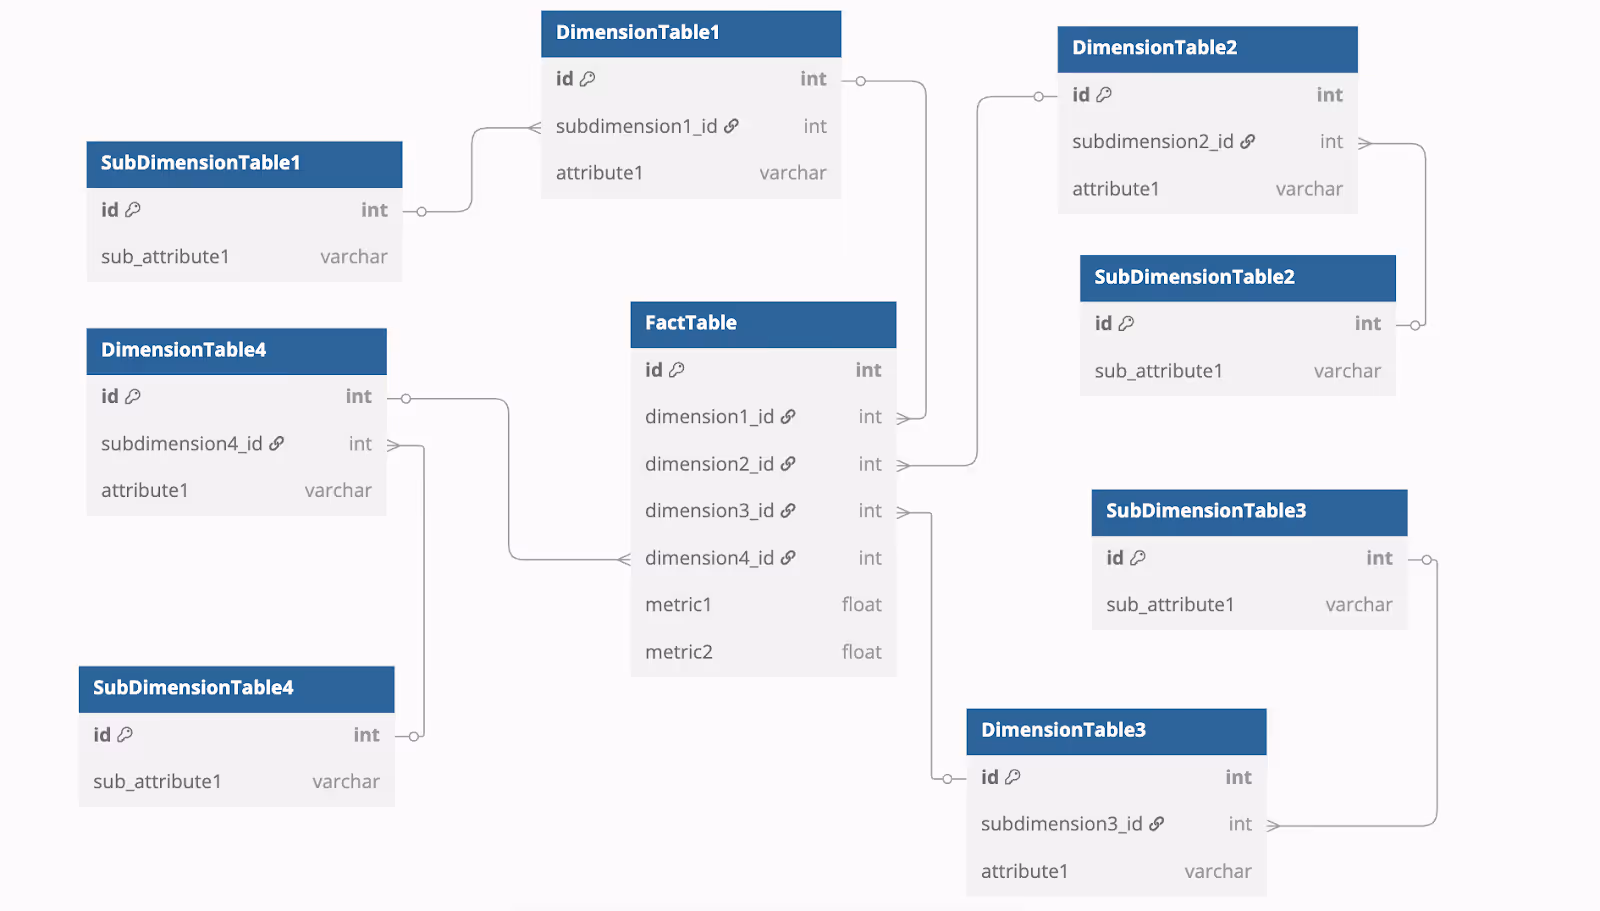
Expanding on the star schema, the snowflake schema normalizes dimension tables by splitting them into sub-dimensions. This approach creates a hierarchical structure that reduces redundancy and improves data integrity.
While it enhances storage efficiency, the increased normalization can lead to more complex queries due to additional joins between tables, impacting query performance in some cases.
💡 Looking to master the intricacies of Snowflake schema? Explore the details of the Snowflake Schema, how it compares to the Star Schema, and when it’s the best choice for your data warehouse.
Linking multiple fact tables to shared dimension tables, the fact constellation schema forms a complex, multi-dimensional model. Often called the galaxy schema, this design supports advanced analytical queries by interconnecting multiple star schemas.

While it enhances flexibility for handling complex datasets, managing and maintaining this structure requires more effort due to its intricate relationships.
Designing a dimensional model involves defining business processes, grain, dimensions, facts, and schema, following Kimball’s Four-Step Methodology.
We will be using an example of an e-commerce company to demonstrate how to implement dimensional data modeling. The e-commerce company wants to analyze sales performance. The goal is to track daily sales transactions, including order details, customer demographics, and product performance.
The first step is to define the business process that needs to be analyzed. In this case, the company wants to monitor customer purchases, track order details, and evaluate product sales.
Clearly identifying the process ensures that the right data points are captured. Techniques like Business Process Modeling Notation (BPMN) or Unified Modeling Language (UML) can help visualize these workflows. A well-defined process improves data quality and supports effective decision-making in analytics and reporting.
Once the business process is defined, the next step is to establish the grain, or level of detail, in the fact table. For the e-commerce company, the best approach will be to store each order line item separately, rather than just daily or monthly summaries.
This allows for detailed insights, such as analyzing individual product performance, tracking customer preferences, and monitoring pricing trends. Choosing the right grain ensures a balance between query performance, storage efficiency, and data retention.
Dimensions provide the descriptive details that help categorize data. In this scenario, key dimensions will include:
Properly defining dimensions ensures that reports can filter and group sales data effectively, improving business insights and decision-making.
Facts are the measurable business transactions stored in fact tables. For this e-commerce company, the key facts include:
By linking these facts to dimension tables through foreign keys, the company can analyze trends like best-selling products, peak sales periods, and customer purchasing behavior.
The final step is to structure the fact and dimension tables into a schema. The company can choose between:
For this e-commerce use case, a star schema is ideal because it supports fast sales analysis and reporting, making it easier to retrieve customer and product insights efficiently.

Various tools help design and manage dimensional data models efficiently. These platforms support schema creation, data visualization, and optimization, making it easier to build scalable and well-structured data warehouses.
OWOX BI is a powerful cloud-based data modeling and analytics platform designed to streamline data collection, transformation, and visualization. It enables businesses to build dimensional data models without extensive SQL knowledge, making data analysis more accessible.
OWOX BI simplifies dimensional data modeling by automating data preparation and ensuring a structured, analytics-ready data warehouse.
dbt is an open-source tool designed for transforming raw data within cloud-based data warehouses. It enables data analysts and engineers to apply software engineering practices to data workflows, improving efficiency and scalability. With SQL-based transformations, version control, and testing frameworks, dbt supports platforms like Snowflake, BigQuery, and Redshift, making it ideal for modern BI reporting.
Lucidchart is a cloud-based diagramming tool that simplifies database modeling and visualization. It allows users to create entity-relationship diagrams (ERDs) and map out database structures with a drag-and-drop interface. Supporting real-time collaboration and integrations with Google Drive and Slack, Lucidchart is ideal for teams working on conceptual database designs and process mapping.
Draw.io is a free, browser-based diagramming tool that simplifies data modeling with an intuitive drag-and-drop interface. It allows users to create entity-relationship diagrams (ERDs) quickly, making it a great choice for structured data models. With an SQL plugin for automatic entity generation, Draw.io is ideal for database design, finance models, and data architecture visualization.
SQuirreL SQL Client is a free, open-source tool designed for exploring and managing relational databases. It supports most major databases and allows users to visualize database structures and create entity-relationship diagrams from existing schemas. Easy to install and deploy, SQuirreL SQL is a great choice for businesses looking for flexible and cost-effective database modeling solutions.
DbSchema is a database design tool that supports visual data modeling, schema synchronization, and automated database tasks. It allows users to build queries, compare databases, and generate documentation in formats like HTML and PDF. With both free and paid options, DbSchema is a flexible solution for designing, managing, and optimizing relational database schemas across various platforms.
Implementing dimensional data modeling comes with challenges such as data quality issues, historical data tracking, performance optimization, and complex data integration. Addressing these challenges ensures accurate reporting, efficient queries, and a scalable data warehouse.
Poor data quality can lead to inaccurate analysis and unreliable decision-making. Inconsistent formatting, duplicate records, missing values, and errors in dimension tables can cause discrepancies in reports. Without proper validation and cleansing, these issues can spread across the data warehouse, reducing trust in the system.
Tracking historical data can be difficult when records are updated without preserving previous values. Changes in natural keys, system migrations, or overwrites can lead to data loss, making it hard to analyze trends over time. Without a structured way to store past information, businesses may struggle with inconsistent reporting and incomplete insights.
Optimizing performance in dimensional modeling can be challenging as data volume grows. Complex joins, inefficient indexing, and poorly structured queries can slow down processing times. Large fact tables with high cardinality dimensions further increase query load, making data retrieval slower and impacting overall system efficiency.
Integrating data from multiple sources into a dimensional model can be complex, especially with manual data migration processes. It requires technical expertise to ensure consistency and accuracy. ETL tools like Airbyte can automate data extraction, transformation, and loading, reducing errors and improving efficiency. A well-structured integration process ensures seamless data flow into the warehouse.
Following best practices in dimensional data modeling ensures efficient data organization, faster queries, and accurate reporting. Key strategies include maintaining a clear grain, using surrogate keys, and optimizing schema design.
Defining the grain early ensures that fact tables store data at the right level of detail for accurate analysis. Each business process should have a consistent grain to prevent miscalculations in reports. For example, tracking daily transactions vs. monthly summaries requires separate models. Using date dimension tables helps structure data for better filtering and grouping in reports.
Surrogate keys are unique, sequential numbers used in dimension tables to keep data consistent and simplify joins. Unlike natural keys, which can change or vary across systems, surrogate keys stay the same, making it easier to track historical changes. They help prevent conflicts, speed up queries, and provide a reliable way to manage data over time.
Keeping dimension tables denormalized improves query performance and simplifies data retrieval. Over-normalization can lead to excessive table joins, making queries slow and complex. For example, splitting a customer dimension into multiple sub-dimensions for name, address, and phone increases complexity. Grouping related attributes within a single dimension ensures better usability, faster queries, and more efficient reporting.
A well-structured fact table improves query efficiency and storage management. Keeping only essential metrics while minimizing unnecessary columns ensures faster data retrieval. Fact tables should be designed to store quantifiable business data, linking to dimension tables for context. Implementing partitioning, indexing, materialized views and avoiding redundant attributes help optimize performance and support scalable data analysis.
Managing changes in dimension attributes requires selecting the right SCD type (Type 1, Type 2, Type 3, etc.) based on business needs. ETL processes help maintain records by tracking modifications, while Change Data Capture (CDC) ensures real-time updates. Using timestamps and effective date columns improves historical tracking, enabling accurate reporting and better decision-making in evolving datasets.
Designing a scalable dimensional data model is essential for efficient analytics and reporting. OWOX BI simplifies this process by automating data collection, transformation, and visualization. With seamless integration across multiple platforms, it ensures accurate and up-to-date insights for data-driven decision-making.
By leveraging OWOX BI, businesses can optimize their data warehouse performance without manual effort. The platform supports flexible schema modeling, real-time data updates, and advanced analytics. Start your free trial today and enhance your data strategy effortlessly.