
8 Mistakes in Data Modeling and How to Avoid Them
Improve data model reliability by avoiding key mistakes. Discover the best data modeling practices for accuracy, consistency, and business alignment.


Accurate reporting starts with a solid data model, but common mistakes can make reports unreliable and misleading. Issues like mismatched data levels, broken relationships, and lack of input from key stakeholders can lead to confusion and poor decisions.
The good news? These mistakes are easy to avoid once you know what to look for. This article covers seven common data modeling mistakes, how they affect reporting, and simple ways to fix them.
When Business Oversight Fails: The Risk of Broken Data Models
There are multiple benefits of data modelling, but only when its executed in a proper method. A flawed data model doesn’t just cause minor reporting issues- it can lead to serious business risks. Inaccurate data can drive poor decisions, misaligned strategies, and lost opportunities. Without proper oversight, organizations may unknowingly base critical choices on unreliable insights, eroding trust in their reports.
The biggest danger? These risks often go unnoticed until they have a real impact. Misaligned models can misrepresent financials, distort performance metrics, and create inefficiencies that ripple across teams. If stakeholders can't rely on reports to reflect reality, decision-making becomes reactive instead of strategic.
A well-structured data model isn’t just about organization – it’s about ensuring confidence in every report. Without a solid foundation, businesses risk wasted resources, compliance issues, and a fragmented approach to data-driven strategy.
8 Common Data Modeling Mistakes That Lead to Inaccurate Reports
Even minor mistakes in data modeling can lead to inaccurate reports, misinformed decisions, and operational inefficiencies. Understanding these common pitfalls helps businesses build reliable, scalable, and effective data models.
If you prefer to read - you can do it right below, but if you prefer to watch a great video on Data Modeling Mistakes - you can do it right here:
1. Failing to Involve All Relevant Stakeholders in Data Modeling
A common data modeling mistake is failing to engage all relevant stakeholders from the start. While executives and department heads provide input, end users, who rely on reports daily, are often overlooked. Without their involvement, critical business needs and metric definitions are missed, leading to models that do not align with business needs and how data models reflect real business objects.
Impact of the Mistake
Leaving out key stakeholders can create a data model that doesn’t fully support business needs. Different teams may define metrics in their own way, leading to inconsistent reports and unreliable insights. This causes confusion, delays adoption, and results in costly last-minute fixes. If reports don’t align with what users need, dashboards may be rejected, leading to wasted time and extra work.
For example, a sales company builds a dashboard with input only from executives and finance, ignoring sales managers and reps. The model tracks total revenue and deal closures but misses regional trends and individual performance. Since the sales team finds it unhelpful, they revert to manual tracking, slowing decisions, and delaying strategy updates.
Strategies To Avoid This
Identify and involve key stakeholders early, including report users, data owners, and department heads. Conduct discussions to align metric definitions and resolve discrepancies.
As for the above example, the strategy adopted would be for the company to revisit the data model and include sales managers and field reps in the design process. The updated model now tracks daily sales, deal stages, lead sources, and rep performance metrics.
2. Lack of Standardized Naming Conventions
Inconsistent naming conventions in data models lead to confusion and inefficiencies. Data professionals often modify column names for clarity, assuming their version is more intuitive. However, business users are accustomed to existing terms, making changes disruptive.
Additionally, some teams rely on system-generated names, leading to inconsistencies. Without standard guidelines, different teams create varying terminologies, making it harder to maintain consistency across reports and databases.
Consequences of This Mistake
Inconsistent naming makes it harder for business users to adapt to new reports and for analysts to track original data sources. It also creates confusion between teams, making collaboration difficult and slowing down report creation. Without clear, standard names, errors increase, and efficiency drops.
Let's look at a use-case scenario:
A B2B sales company tracks leads, deals, and revenue across multiple teams. However, naming inconsistencies in their data model leads to confusion and inefficiencies:
- The Finance Team calls revenue "Total Sales", while Sales calls it "Deal Amount".
- The Marketing Team tracks leads as "Lead_ID", but Sales uses "Customer_ID".
- The Sales Team logs team members as "Sales Rep", while Operations calls them "Account Manager".
- The IT Team stores deals as "sales_amt_001", using system-generated names.
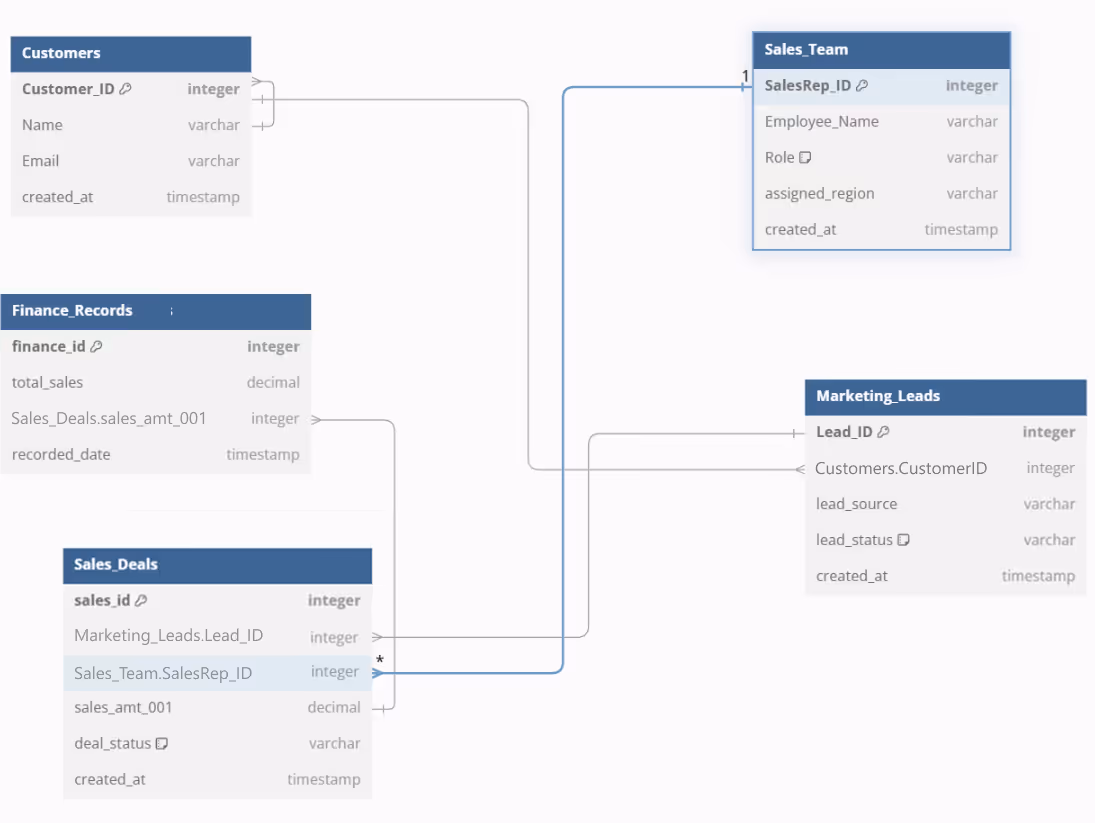
Due to these inconsistencies, reports from different departments do not align, making it difficult to track actual revenue, active deals, and lead conversions. Sales forecasts are inaccurate, and leadership struggles to make data-driven decisions.
Effective Solutions to Fix This Problem
Use business naming conventions in column names to maintain consistency and improve adoption. Implement a data dictionary to document system names alongside business terms, ensuring clarity across teams. This approach enhances communication, simplifies self-service analytics, and ensures that business users can explore datasets without confusion.
So, to solve the above problem of inconsistent naming, the company can use standardized field names, ensuring consistent references for customers, deals, and revenue across all teams. Sales reps will now be able to track their performance easily, and reports will be matched across departments.
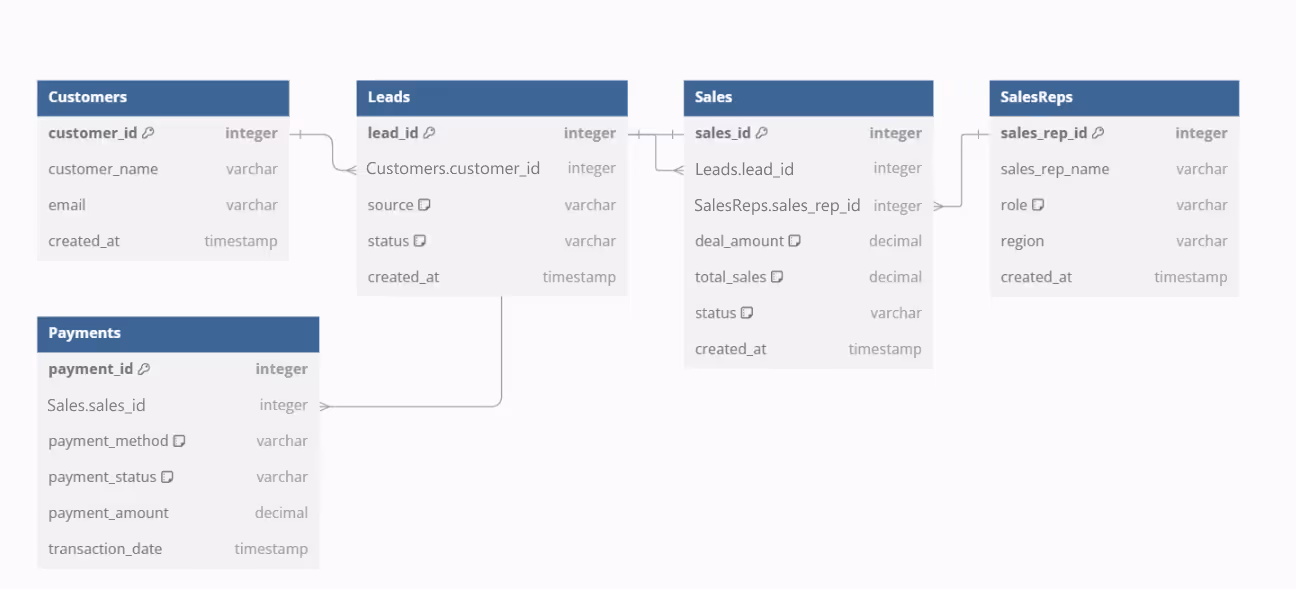
The updated data model in the image ensures consistency across teams, improving reporting and decision-making. Finance and Sales now use "Total Sales" for revenue, while Marketing and Sales track leads under "Lead_ID".
Sales and Operations align on "Sales Rep", and IT has replaced system-generated names like "sales_amt_001" with "deal_amount" for clarity.
3. Incorrect Relationships Granularity
One common mistake in data modeling is not aligning granularity with reporting needs. Capturing too much detail can make datasets slow and difficult to manage, while too little detail can overlooking key insights. This often happens when reporting requirements aren’t clearly defined at the start, leading to inefficient models and inaccurate reports.
Consequences of Getting It Wrong
A data model with too much detail slows down queries, increases storage costs, and becomes hard to manage. Too little detail, however, can miss key data, making analysis difficult. Both issues lead to inaccurate insights and poor decision-making.
For example, a retail company tracks every transaction in detail, making reports slow and costly. Meanwhile, finance needs summaries, but the model lacks regional and product breakdowns, making trend analysis hard. Without the right granularity, important insights are lost, delaying decisions and affecting revenue planning.
How to Avoid This Pitfall
To get the right granularity, define reporting needs before building the model. Work with stakeholders to decide the necessary level of detail. Use aggregated tables for faster performance while keeping raw data for deeper analysis. Regularly check that the model meets reporting needs.
As for the above example, the company should update its model to balance detail and performance. The new version should include regional and product breakdowns, providing high-level insights and detailed trends.
4. Misdefining Relationships and Overusing Array Fields
Misdefining relationships happen when modelers ignore cardinality rules or misunderstand how entities depend on each other. One-to-many relationships are easy to set up, but complex ones are sometimes turned into array fields to avoid joins. This may seem simpler at first, but it can cause problems with filtering, aggregation, and scalability as the data grows.
Negative Consequences
Incorrect relationships can slow down queries and make data retrieval difficult. Using too many array fields limits flexibility, making it harder to filter or group data. If the model doesn’t account for changing relationships, future updates become expensive and time-consuming. Poor structure can also lead to inaccurate reports and poor decisions.
For example, a marketing analytics company tracks customer interactions but stores them all in an array field within the Customers table instead of a separate table. This setup makes it harder to analyze and organize interactions properly.
While this seems convenient at first, as data grows:
- Customers → Stores customer details but incorrectly keeps all interactions in an array field instead of linking them properly.
- Campaigns → Stores marketing campaigns to track engagement.
- (Incorrect) Customer Interactions → Stored as an array inside Customers, making filtering and aggregation difficult.

Marketing teams struggle to generate detailed campaign performance reports, leading to incomplete insights and poor decision-making.
Best Practices to Define Relationships
Before using array fields, assess whether filtering or grouping will be required in future queries. Structure relationships based on entity dependencies, using proper one-to-many or many-to-many models instead of unnecessary arrays. Ensure consistency by defining clear primary and foreign key relationships.
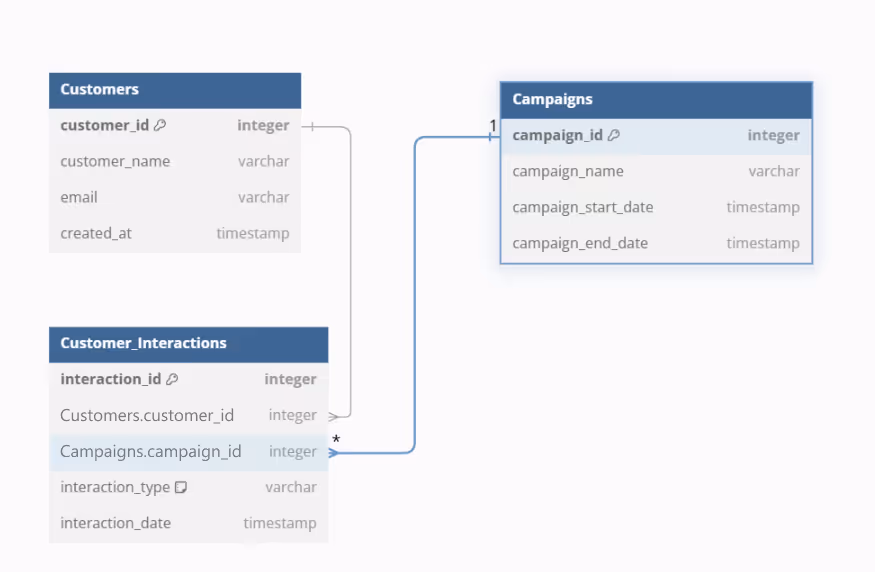
To fix the issue above, the company can remove the array field and create a separate table for interactions, ensuring easy filtering, grouping, and aggregation.
The updated model should include the following objects:
- Customers → Stores customer details.
- Campaigns → Stores marketing campaigns.
- Customer_Interactions → New table that links customers to campaigns, allowing proper filtering and aggregation.
5. Ignoring How Applications Interact with the Data Model
A data model should be designed for both reporting and how applications retrieve, process, and update data. When indexing, query patterns, and API interactions are overlooked, reports can become slow and unreliable.
If the model doesn’t align with how business applications interact with data, reports may fail to reflect real-time changes, making decision-making harder and less effective.
Impact of the Mistake
A poorly optimized data model can slow down reports, cause inefficient queries, and make applications lag. It can also lead to data quality issues, making reports less accurate. Over time, this increases maintenance costs and technical problems.
For example, a retail company has a sales reporting system, but the data model is built only for storage, not for reporting. Without proper indexing or query optimization, reports take minutes instead of seconds to generate.
Since the reporting tool often aggregates sales by region and product category, the lack of indexing and pre-aggregated tables makes queries slow, frustrating users and delaying insights.
Strategies To Avoid This
Before designing a data model, consider how applications will use the data. Optimize indexing, partitioning, and queries based on usage patterns. Work with developers to ensure the model supports business workflows and allows fast, efficient data retrieval. Regular testing and performance checks help keep the model running smoothly.
To solve the earlier issue, the company restructures its data model to match reporting needs. They add indexes on key fields like region and product category, create pre-aggregated summary tables, and optimize queries for faster reports.
6. Overcomplicating the Data Model
Ever tried reading a map filled with unnecessary details? It’s overwhelming 🤯.
Same goes for overcomplicated data models—too many unnecessary tables that no one really uses for reporting, complex relationships that require many joins or worse - multiple join paths, and redundant fields can make it nearly impossible to maintain…
Example
A company tries to model every single customer interaction down to the smallest detail, creating hundreds of tables.
The result?
- Nobody understands the model.
- Analysts struggle to build reports.
- Self-service analytics is impossible.
- Querying the database takes hours and it is a nightmare.
💡 How to fix it
It's simple and contains just 2 steps:
✅ Keep your model as simple as possible while maintaining its power.
✅ Focus on business needs—don’t model things you don’t actually need to report on.
A clean, minimal data model is a usable data model.
7. Neglecting Future Scalability in Physical Data Modeling
Many data models are designed to meet immediate needs without accounting for future expansion. As businesses grow, data volume increases, requiring structural changes.
Performance and Maintenance Challenges
A model that lacks scalability can become outdated quickly, requiring costly rework and causing disruptions in reporting and analytics. Query processing slows and increases response times for reports and dashboards.
Additionally, maintaining an inflexible model requires frequent adjustments, making database management inefficient and prone to errors. Over time, this creates technical debt and operational bottlenecks.
For example, a growing e-commerce company builds a sales reporting model that works fine at first, but as sales data increases, reports become painfully slow. The model stores all transactions in a single large table with no partitioning or pre-aggregated data, making monthly and regional sales reports take minutes instead of seconds.
Since reports pull raw transactional data instead of summarized insights, performance drops as query loads increase.
Strategies to Ensure Long-Term Flexibility
To future-proof a data model, implement partitioning, indexing, and normalization techniques that support growth. Use scalable database architectures, such as cloud-based solutions, that adapt to increasing data demands. Regularly review the model to align with evolving business needs, ensuring smooth integration with new technologies and data sources.
To solve the issue in the above example, the company can redesign the reporting model by:
- Partitioning data by month so queries only scan recent sales instead of the entire dataset.
- Creating pre-aggregated summary tables for faster monthly, regional, and product sales reports.
- Adding indexing on key reporting fields like region and product category to improve query performance.
With these changes, reports are generated faster, and dashboards stay responsive even as sales volume grows.
8. Failing to Validate Model Results Against Source Data
Data professionals often assume a model is correct if it runs without errors. However, without checking results against source databases and user interfaces, mistakes can go unnoticed. This usually happens due to tight deadlines, missing validation steps, or relying only on automated checks without manual review.
Issues It Causes
Unvalidated models lead to reporting inconsistencies where aggregated results do not match source data. Business users may question the accuracy of reports, leading to a loss of confidence in the data. Additionally, unresolved pipeline issues, such as missing records or incorrect syncing methods, can introduce silent errors that impact decision-making.
Suppose a retail company builds a sales performance dashboard, assuming the data model is correct because it processes without errors. However, when finance teams compare monthly revenue reports with raw sales transactions, they find mismatches; some orders are missing, and revenue totals don’t align with accounting records.
Since the model was never validated against the source database, unnoticed data sync issues and missing records led to inaccurate reporting.
How to Prevent It
At each stage, check sample records against the source database and user interface. Compare final reports with historical data to spot discrepancies early. A structured validation process helps maintain accuracy and trust.
To fix the issue, the company can cross-check sample records, compare revenue totals with past reports, and use automated scripts to flag errors. Manual reviews at key points ensure data consistency and catch issues early.
Best Practices for Building Reliable Data Models
Building high-quality data models ensures accuracy, completeness, flexibility, and scalability. A well-structured model reduces errors and enhances decision-making.
Below are the key criteria for creating reliable data models.
- Accuracy – Ensures data models reflect real-world scenarios and business rules. Maintaining normal forms and using surrogate keys enhance consistency, supporting reliable data warehousing and BI processes.
- Completeness – A complete model captures all necessary data entities and relationships. Using a data dictionary and metadata prevents gaps, enabling accurate analysis and database design.
- Flexibility – Adaptable models support changing business needs. Relational schemas, cloud-based platforms, and data lakes ensure easy integration and evolution alongside new data sources.
- Scalability – Scalable models handle increasing data volumes and user demands. Using dimensional models and database management systems that support scaling ensures long-term efficiency and performance.
Key Features to Look for in a Data Modeling Tool
With many data modeling tools available, selecting one that supports accurate reporting and analytics is essential.
In this section, we explore key features that help businesses work with well-structured, scalable, and high-performance data models for reliable insights.
Intuitive Interface for Easy Navigation
A data modeling tool should have a user-friendly interface that makes it easy to explore and understand data structures. Users should be able to navigate relationships, modify schemas, and access key details without extensive technical knowledge. A well-designed interface streamlines workflows and improves efficiency in working with data.
Compatibility with Multiple Databases
A robust data modeling tool should support various data warehouses such as BigQuery, Snowflake, AWS Redshift, and DataBricks. This flexibility allows businesses to integrate and manage data across multiple platforms without limitations, ensuring seamless scalability and adaptability to evolving data environments.
Real-Time Collaboration and Feedback
Collaboration is critical in data modeling, especially for teams working across different departments. A tool with real-time editing, commenting, and feedback features allows multiple users to contribute simultaneously. This ensures consistency in data models, improves communication, and speeds up the development process.
Built-in Version Control for Data Models
Version control helps maintain accuracy by tracking changes to data structures over time. A tool with built-in versioning allows users to revert to previous states if errors occur, ensuring stable models and reliable reports. This feature supports auditability and structured data management.
Advanced Data Visualization for Clarity
Understanding complex data relationships is crucial for effective modeling. A tool with advanced data visualization capabilities provides graphical representations of entities, relationships, and dependencies. This improves model clarity, enhances data comprehension, and simplifies the process of validating and optimizing database structures.
Build Reliable, Scalable Data Models with OWOX Data Marts
Most data modeling mistakes stem from fragmented logic, inconsistent definitions, and poorly documented relationships between datasets. These issues not only slow analysis but also erode trust in every report built on top of them.
With OWOX Data Marts, analysts can define models once, document field-level logic, and enforce consistency across all reporting tools, from BigQuery to Google Sheets or Looker Studio. Each data mart acts as a reusable building block, complete with joins, metrics, and schema governance.
By centralizing definitions and automating refreshes, OWOX helps you maintain clean, reliable models that scale with your team and your data.
Frequently asked questions


Finally, a tool that doesn't ask business users to learn a new dashboarding UI. Our marketing team already knows Sheets. OWOX just delivers the right data.
Joinable data marts concept was the thing that sold us. We can now use the semantic layer without building one.
Self-hosted the OSS version on Digital Ocean. Zero vendor lock-in. Contributed a Shopify connector back in week two.