
Essential Google Analytics 4 Reports Every Marketer Should Know
Master GA4 reporting with must-know reports to optimize traffic, conversions, and ROI for data-driven marketing strategies

.png)
Understanding your audience is the key to crafting impactful marketing strategies, and Google Analytics 4 (GA4) is your ultimate ally. With cutting-edge tools and insights, GA4 helps you decode customer behavior throughout the journey.
In this guide, we’ll explore the must-know reports every marketer should leverage in GA4. From real-time analytics to in-depth e-commerce tracking, you’ll discover how to harness GA4’s full potential to stay ahead of the competition.
Why Google Analytics 4 Reports Are a Must-Have for Marketers
The way businesses approach decision-making has transformed significantly over time. In earlier days, intuition or straightforward observations often guided decisions.
As businesses transitioned online, the volume and complexity of user interactions increased dramatically. From basic page views to multi-step purchase funnels, every action left behind a trail of valuable data.
To make sense of this, tools like Google Analytics emerged, turning scattered information into actionable insights that empower more innovative strategies.
Let's look at some of the factors that make GA4 reports essential.
- Track Customer Journeys: GA4 provides a comprehensive view of the customer journey across multiple platforms and devices.
- Real-Time Insights: Monitor user activity as it happens, enabling quick responses to trends and issues.
- Enhanced Data Accuracy: GA4’s advanced tracking capabilities ensure precise data collection, even with increasing privacy restrictions.
- Actionable Metrics: Access detailed reports on user behavior, engagement, and retention to refine your marketing strategies.
- Customizable Reports: Tailor your analytics to focus on the KPIs that matter most to your business goals.
- Revenue Growth: Identify revenue opportunities through monetization and product performance reports.
Navigating the Overview Structure of Google Analytics 4 Reports
Google Analytics 4 organizes its reports into a streamlined structure, making it easier for marketers to access vital data. The intuitive layout ensures you can quickly find insights from standard reports to custom explorations. Let’s explore its key components.
Standard Reports
The Standard Reports in Google Analytics 4 (GA4) are a set of predefined, streamlined reports that provide essential insights into your website or app’s performance. These reports are designed to offer a user-friendly way to access key data without requiring extensive customization.
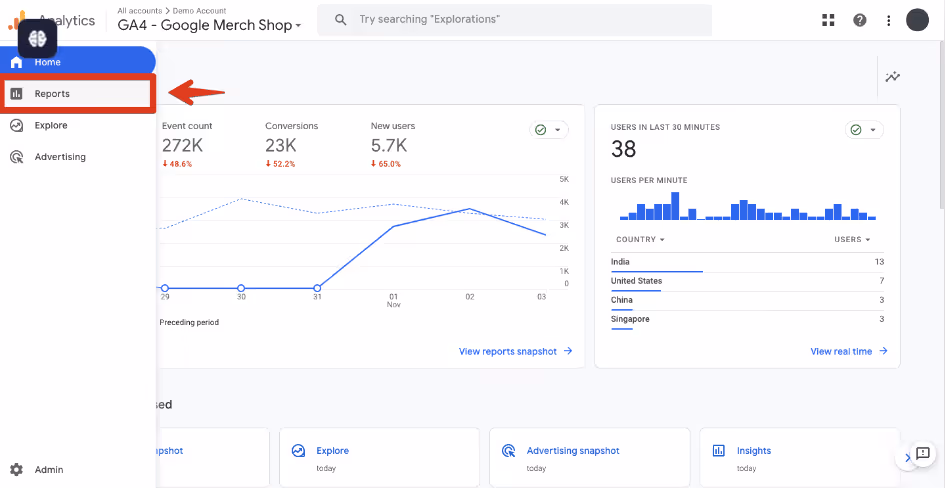
This can be accessed via the Reports section in GA4. You'll find Reports Snapshot, Real-time Overview, Real-time pages report, and the Life Cycle and User Reports collections. Predefined reports vary depending on the business objectives selected during the GA4 property setup.
Reports snapshot report
The Reports Snapshot Report in GA4 provides a high-level overview of key performance metrics, such as user engagement, traffic sources, and conversions.
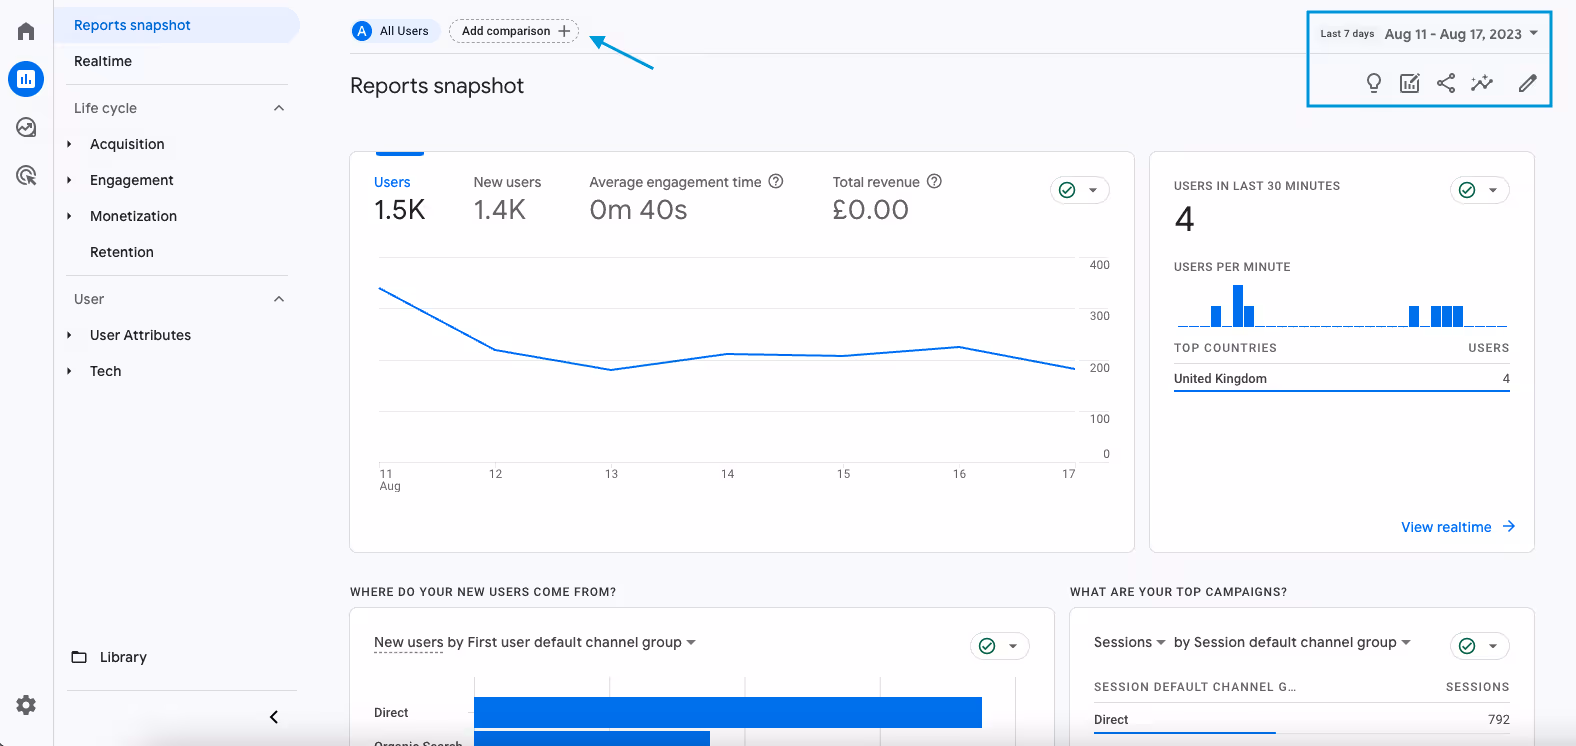
Found in the Reports section, this customizable report offers a quick summary of your website or app’s performance, making it ideal for identifying trends at a glance.
Real-time overview
The Real-Time Report in GA4 shows live user activity on your website or app. Accessible in the Reports section, it displays active users, their locations, events, and conversions as they happen.
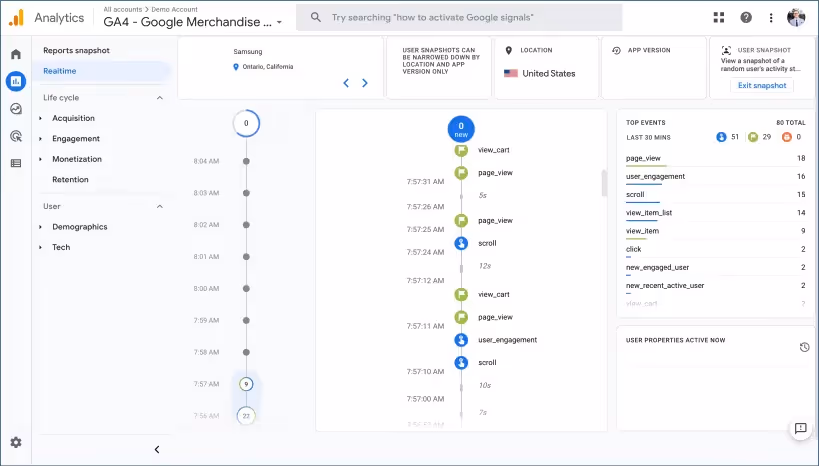
This report is invaluable for monitoring campaigns, troubleshooting, and understanding immediate user behavior.
Life cycle collection
The Life Cycle Collection in GA4 provides insights into the user journey, covering acquisition, engagement, monetization, and retention.
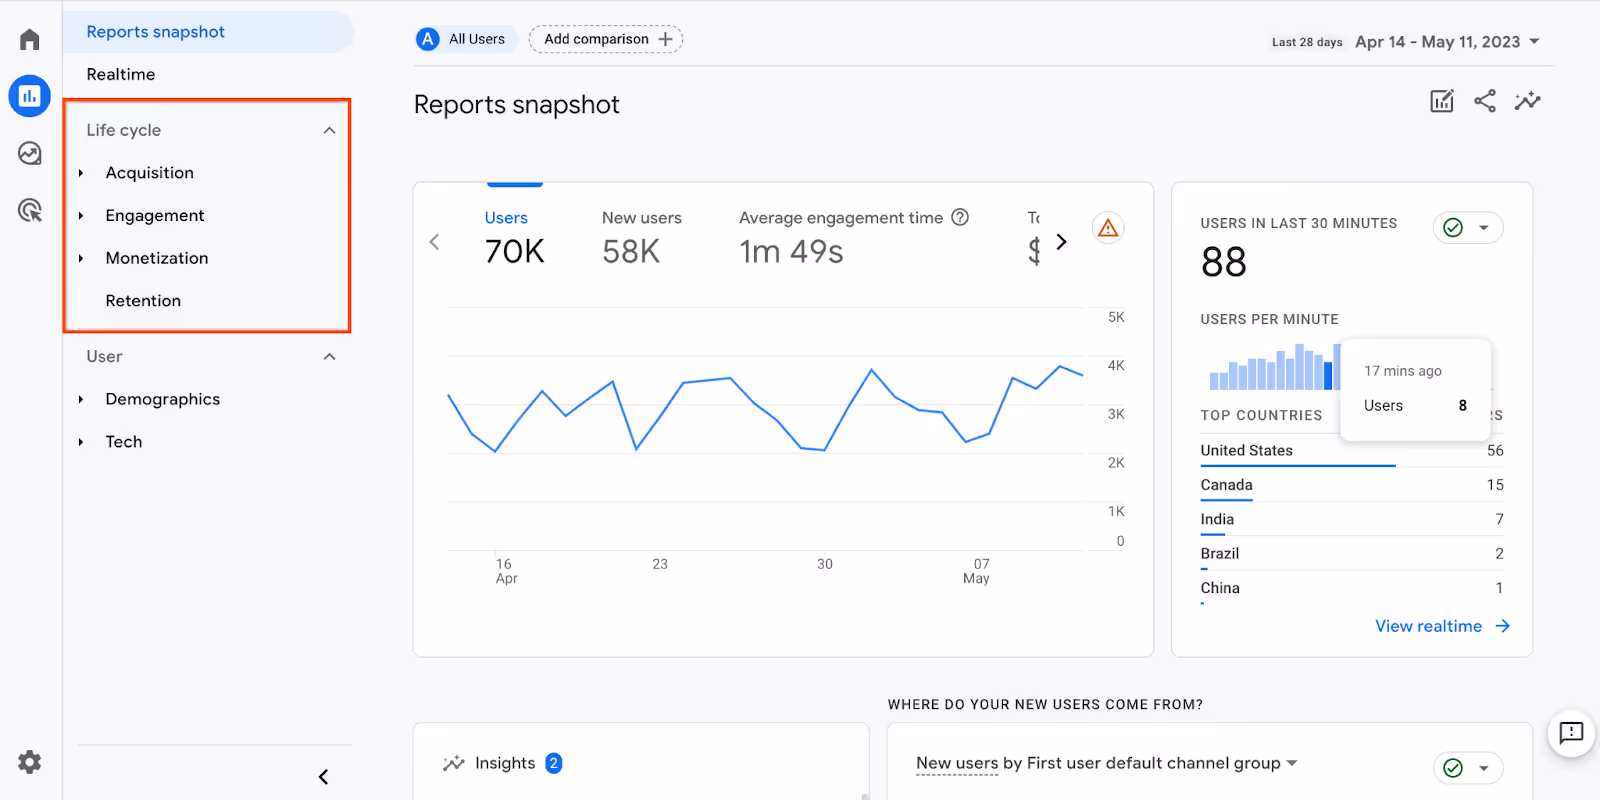
Found in the Reports section, it helps businesses analyze how users interact with their website or app at each stage, offering actionable data to improve performance and optimize the customer experience.
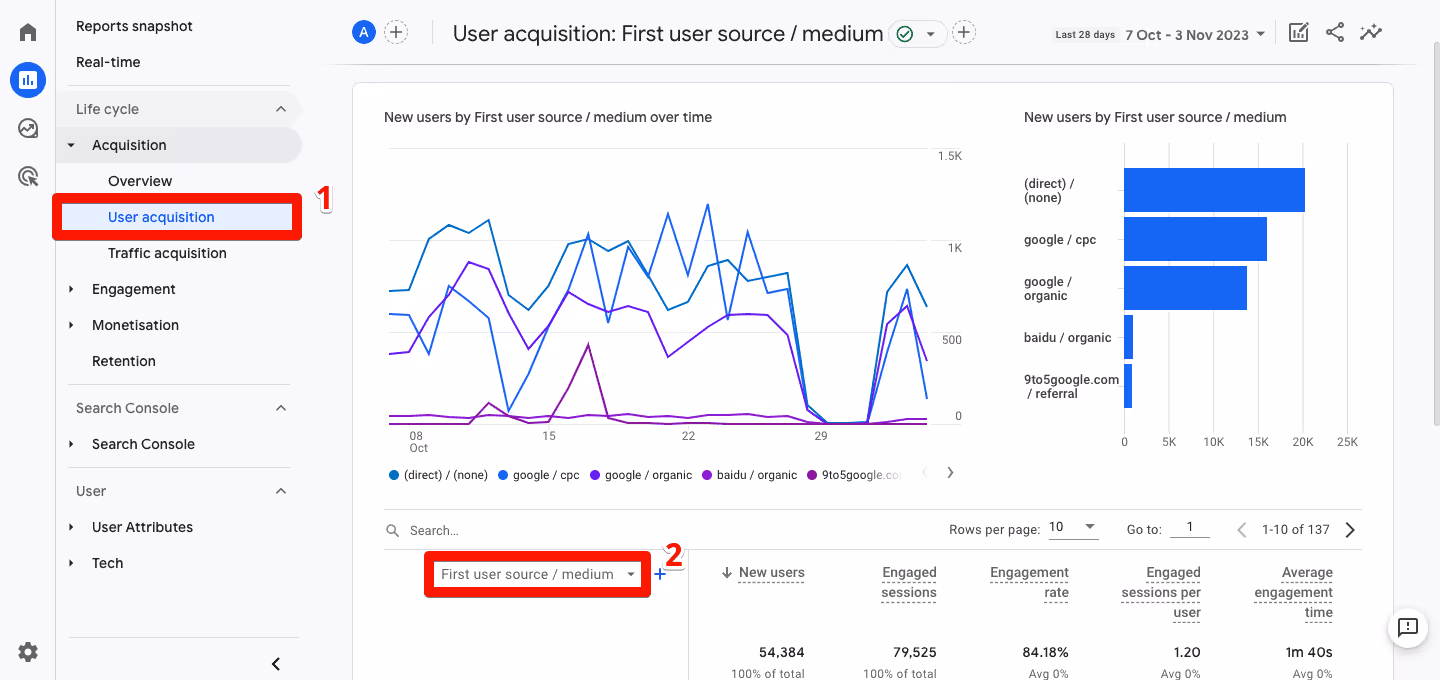
Acquisition reports
Acquisition reports, part of the Life Cycle Collection in GA4, help you understand how users find your website or app. They include the Overview, User Acquisition, Traffic Acquisition, and User Acquisition Cohorts report, offering insights into traffic sources like referrals, organic search, paid campaigns, and direct visits.
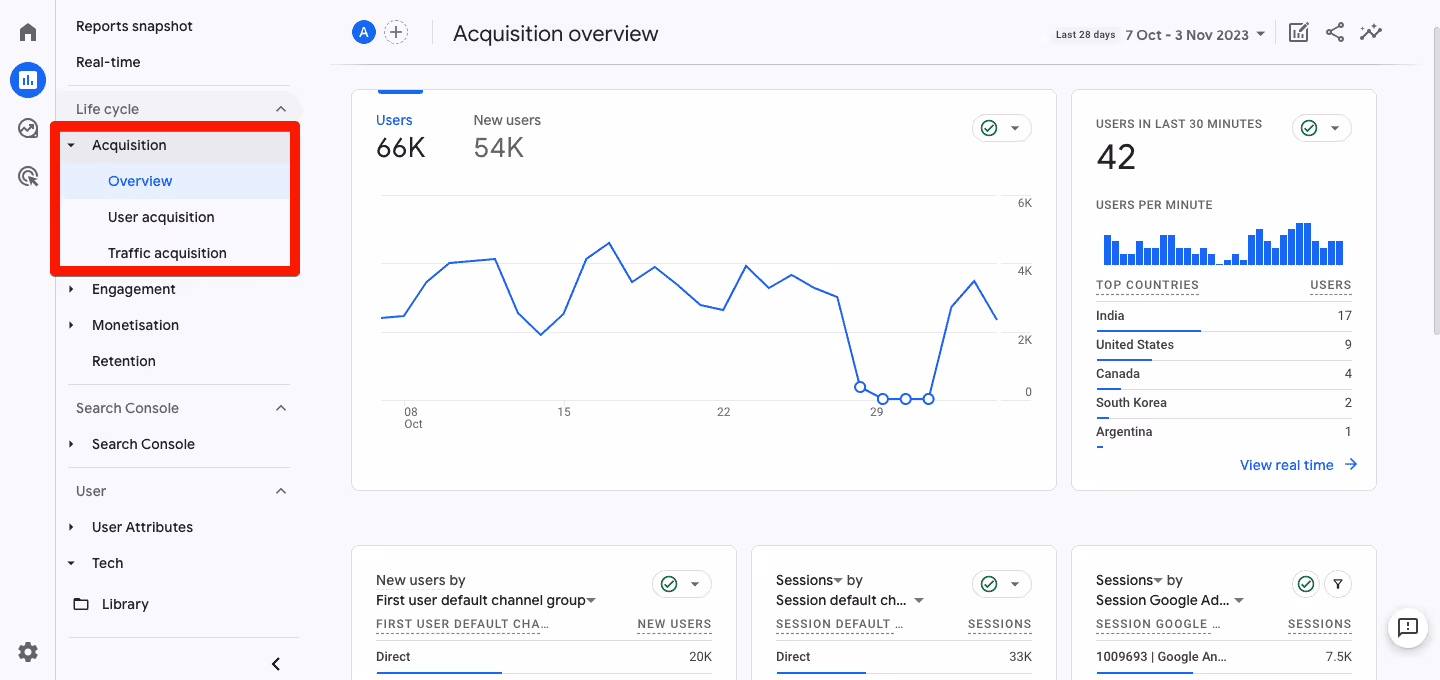
Key sub-reports, such as the Source/Medium Report, Referral Traffic, Organic Search Traffic, and Channels Report, provide a detailed breakdown of user origins, enabling data-driven decisions to optimize marketing efforts and drive engagement.
Engagement reports
Engagement Reports in GA4 focus on user actions after they land on your website or app. These reports include the Overview Report, Events Report, Pages and Screens Report, and Landing Page Report. They provide detailed insights into user interactions, such as pages visited, events triggered, and conversion paths.
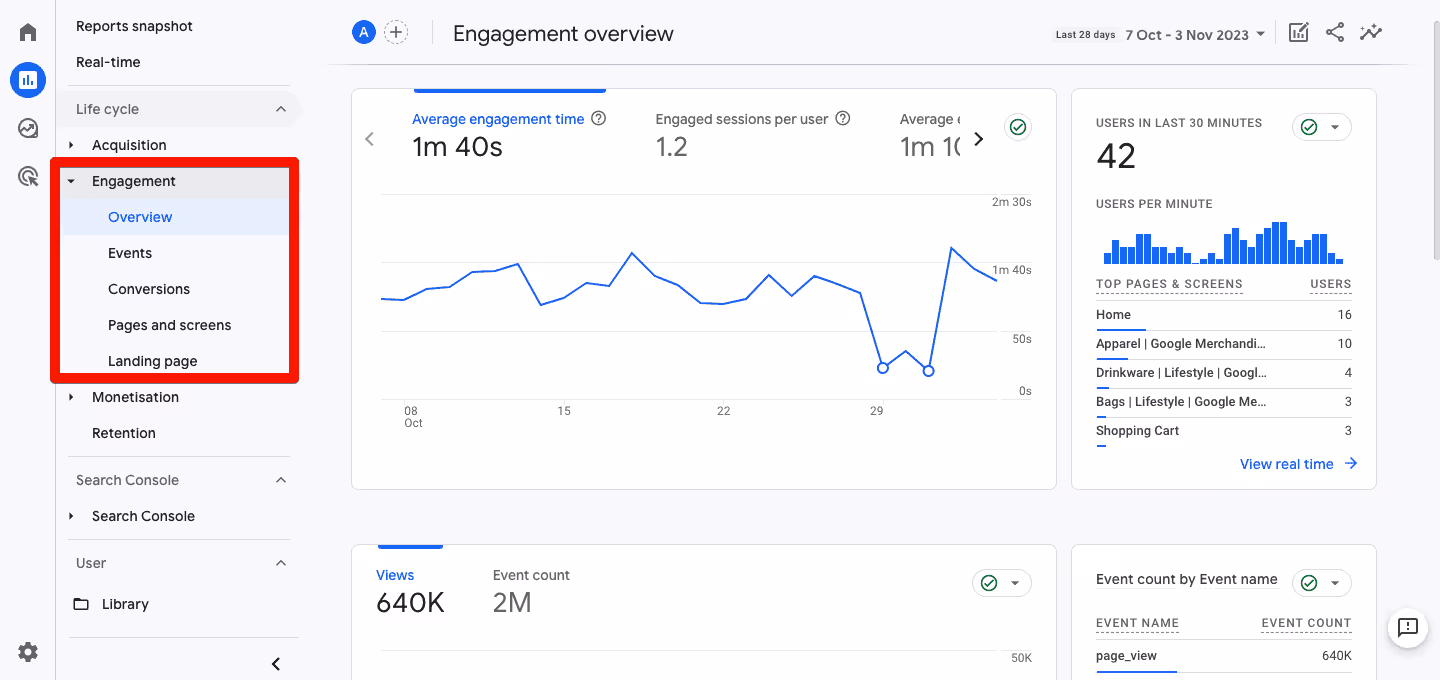
By identifying popular content, user journey patterns, and areas of friction, these reports help businesses enhance site navigation, improve user experience, and drive better engagement across digital platforms.
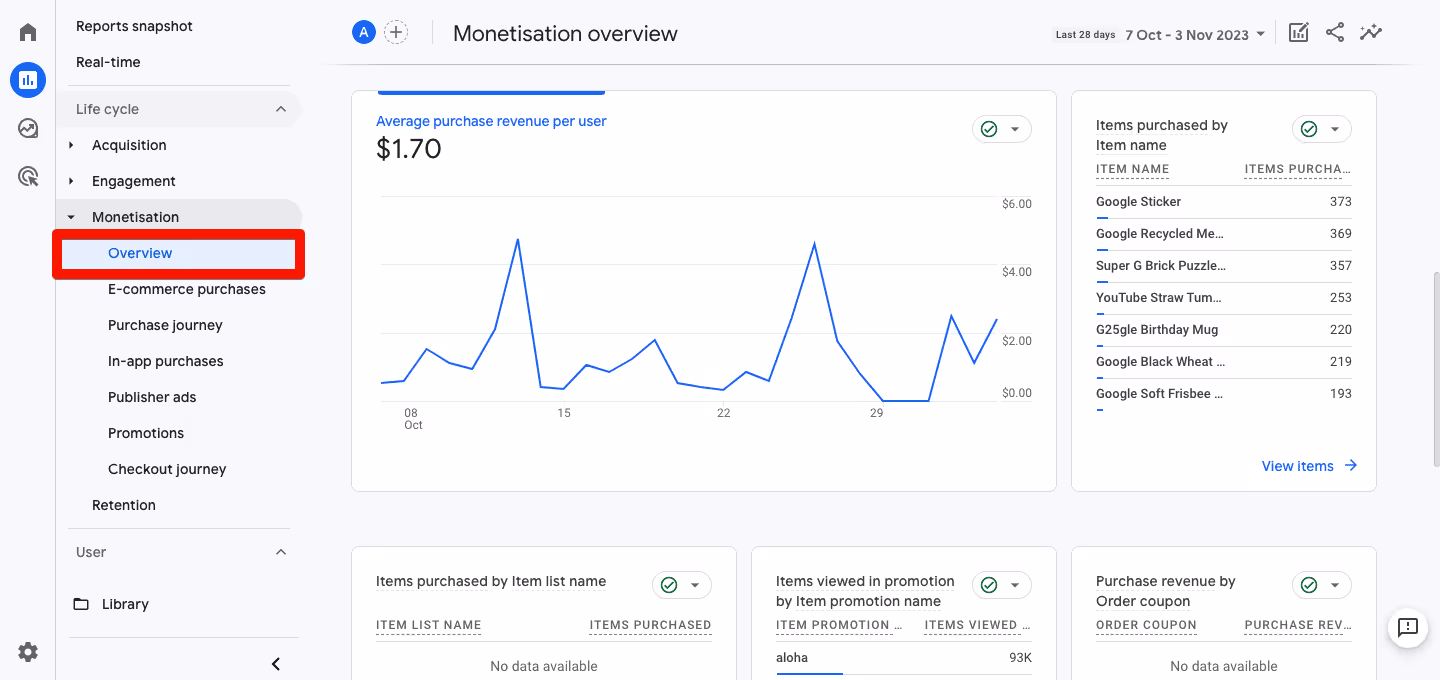
Monetization reports
Monetization Reports in GA4 provide valuable insights into your site’s revenue generation. These include the Overview Report, E-commerce Purchases Report, Purchase Journey Report, In-App Purchases Report, Transactions Report, Promotions Report, and Checkout Journey Report.
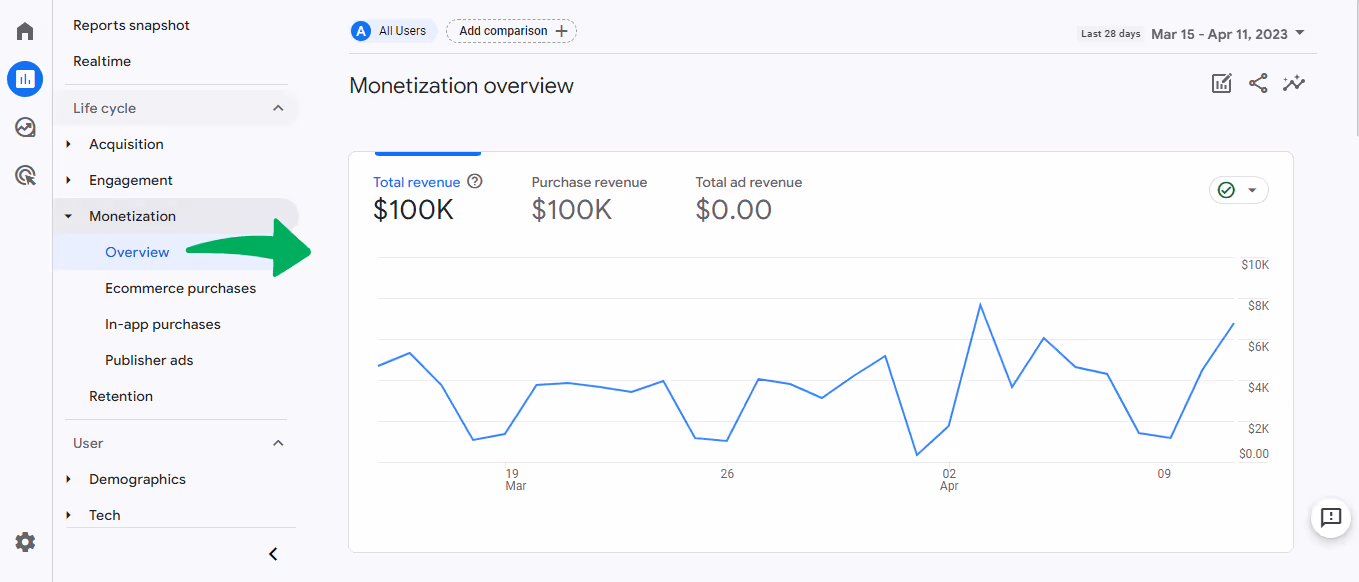
These reports help businesses track product sales, analyze purchase behaviors, and monitor transaction values. Businesses can optimize campaigns, improve product strategies, and enhance revenue streams by identifying bestsellers, effective promotions, and high-converting segments.
Retention reports
The Retention Reports in GA4 summarize how effectively your website or app retains users over time. These reports include metrics such as the average time users spend on your platform and the percentage of users returning daily during their first 42 days.
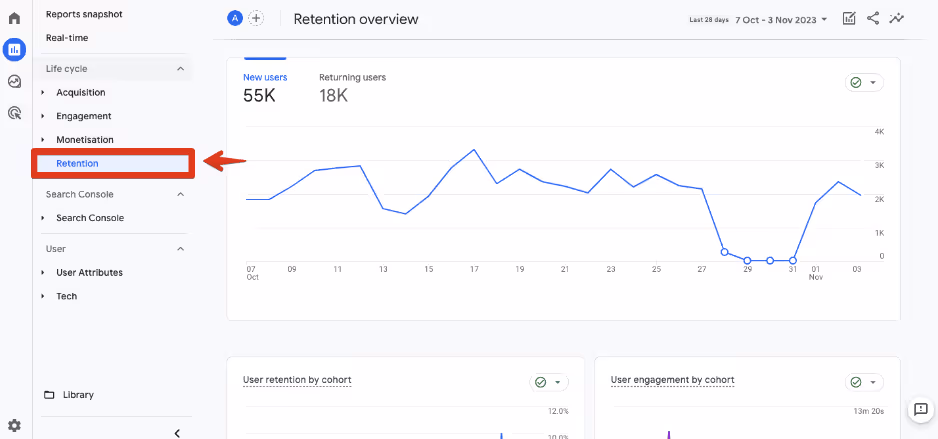
Key summary cards include New Users and Returning Users, User Retention by Cohort, User Engagement by Cohort, User Retention, User Engagement, and Average 120d Value card, providing actionable insights to enhance user loyalty and long-term engagement strategies.
Search Console integration
Search Console integration with GA4 connects your website’s search performance data to your analytics reports. This integration enables you to track metrics like impressions, clicks, average position, and CTR directly within GA4.
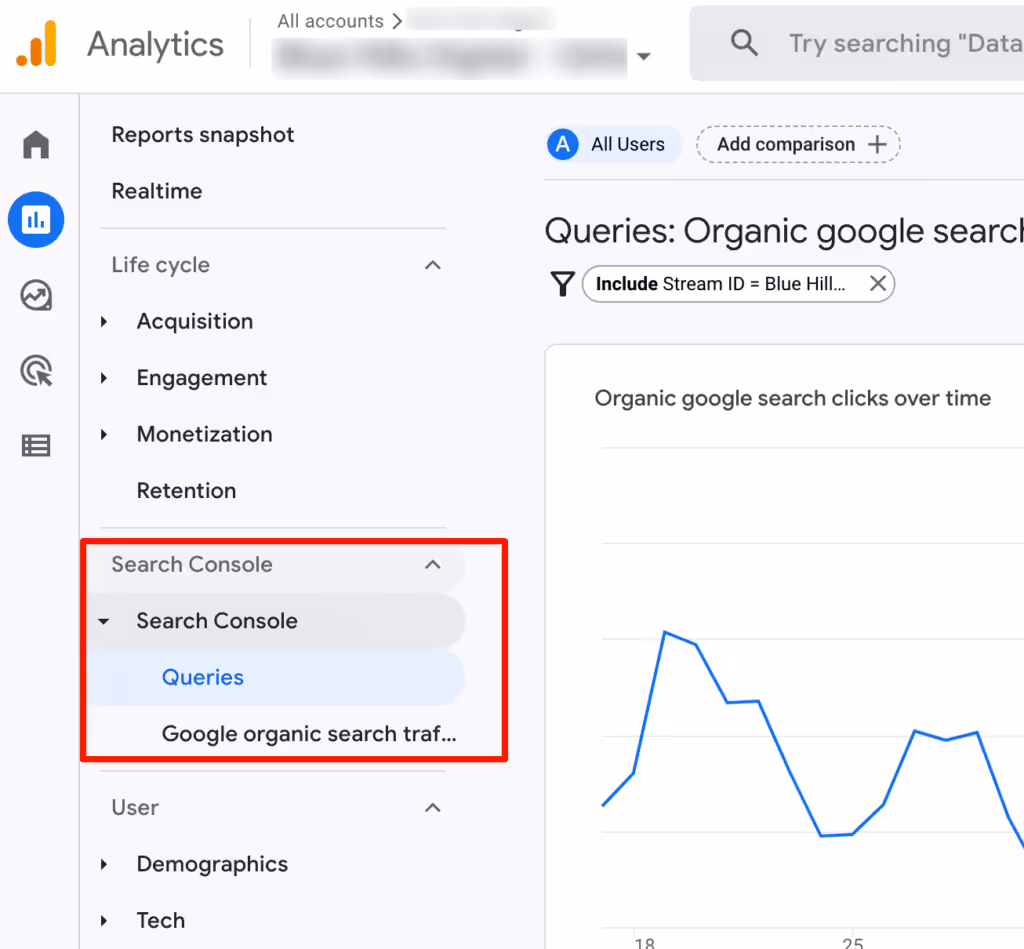
By analyzing this data alongside user behavior metrics, you can identify how organic search contributes to traffic, engagement, and conversions. The integration provides detailed insights into search queries, landing pages, and audience behavior, helping you optimize SEO strategies.
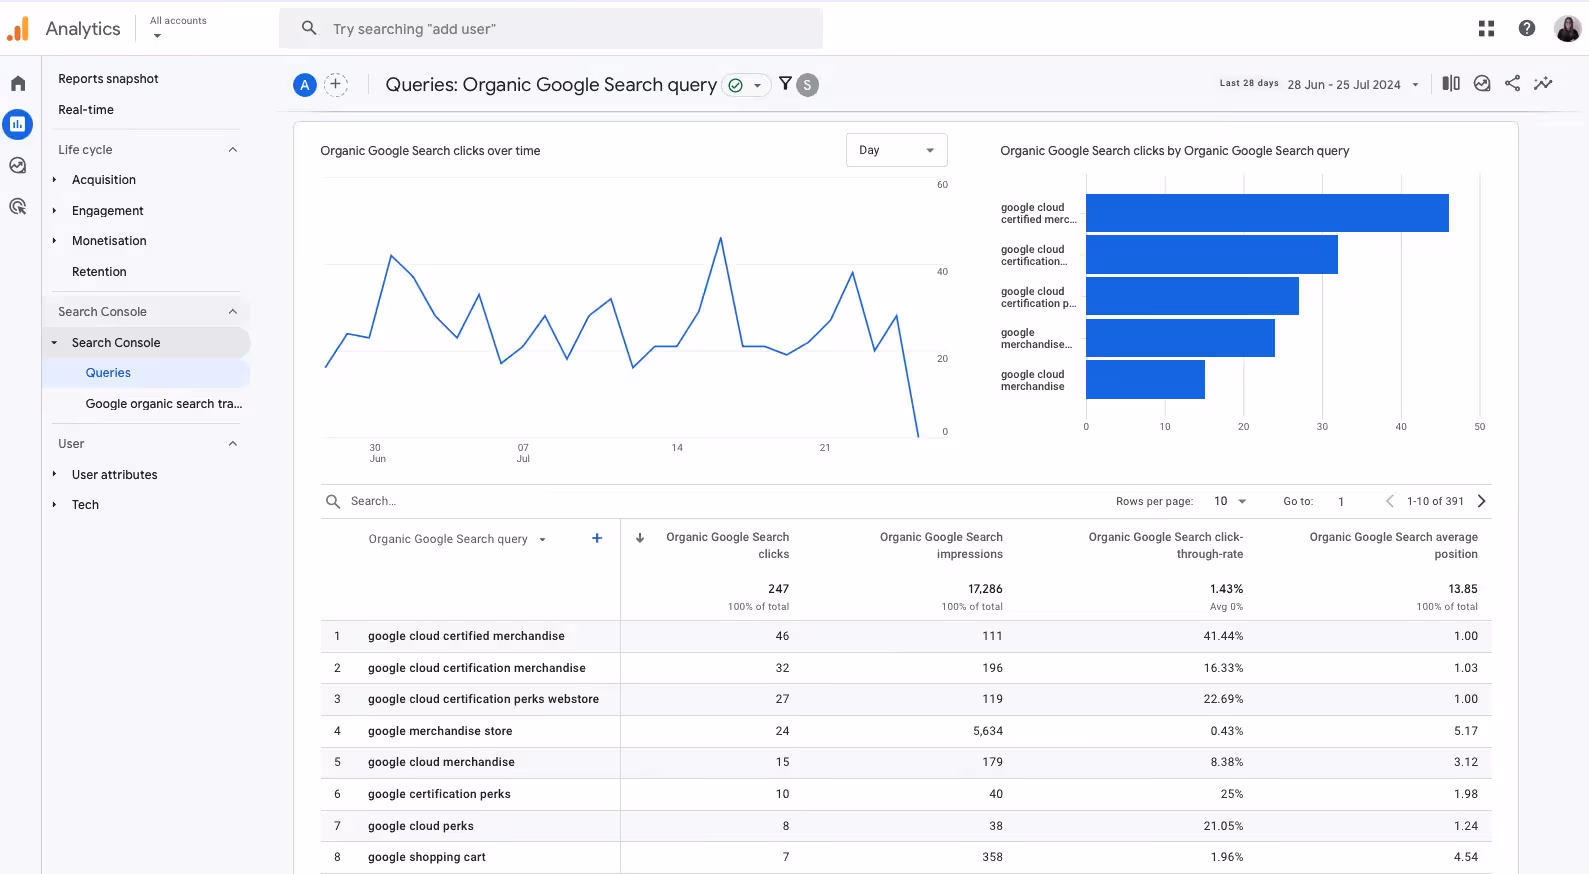
Queries
The Queries Report in GA4 (available through Search Console integration) provides detailed insights into users' search terms to find your website. It includes key metrics such as impressions, clicks, average position, and click-through rate (CTR) for each query.
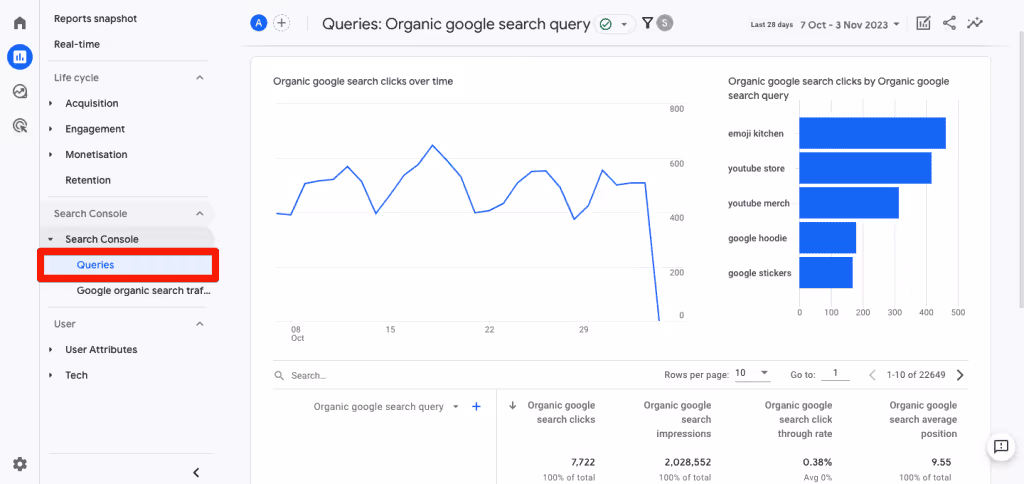
This report helps identify high-performing keywords, uncover opportunities for optimization, and understand how search behavior aligns with your content strategy.
Google organic search traffic report
The Google Organic Search Traffic Report in GA4, accessible through Search Console integration, tracks key metrics like Clicks, Impressions, and Click-Through Rate (CTR) for traffic originating from organic search.
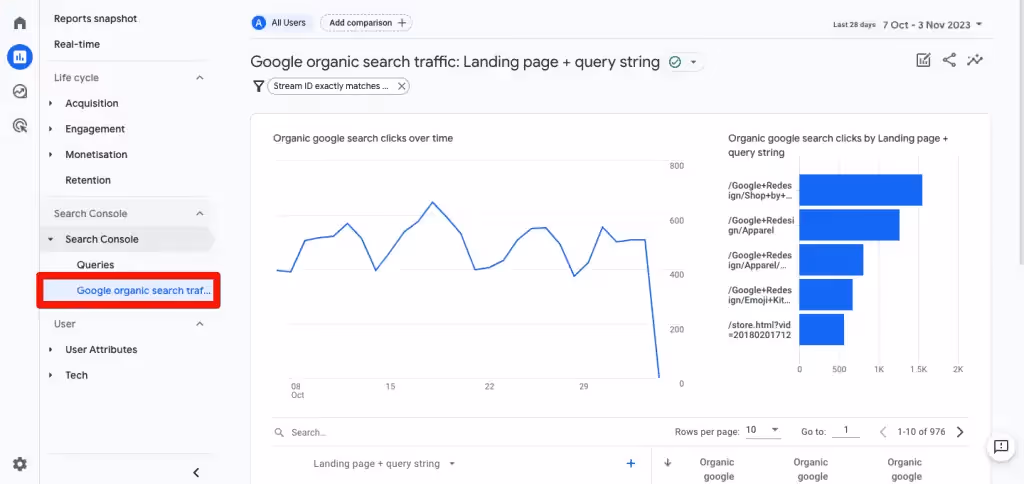
This report helps identify which search queries and landing pages drive the most traffic and engagement. By analyzing these metrics, businesses can evaluate the effectiveness of their SEO strategies, optimize underperforming pages, and focus on high-performing keywords.
User
The User section in GA4 provides insights into your website or app users' demographics, interests, and behaviors. It includes reports on User Attributes and Tech, offering a comprehensive view of who your audience is and how they interact with your content.
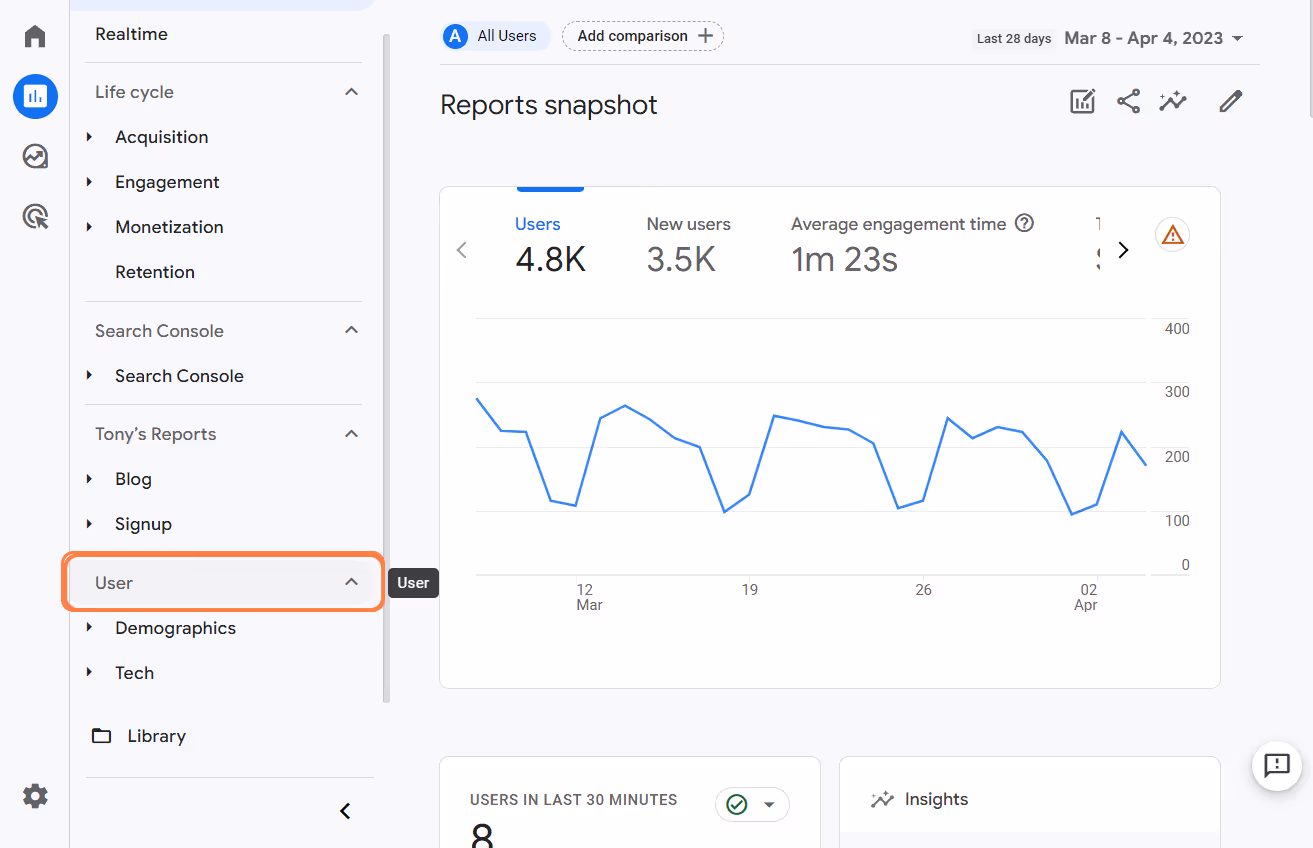
This section is essential for tailoring marketing strategies and creating relevant content that aligns with user preferences.
User attributes
The User Attributes subsection in GA4 focuses on demographic and audience data. The Demographic Details report provides insights into user age, gender, and location, helping businesses understand their audience composition.
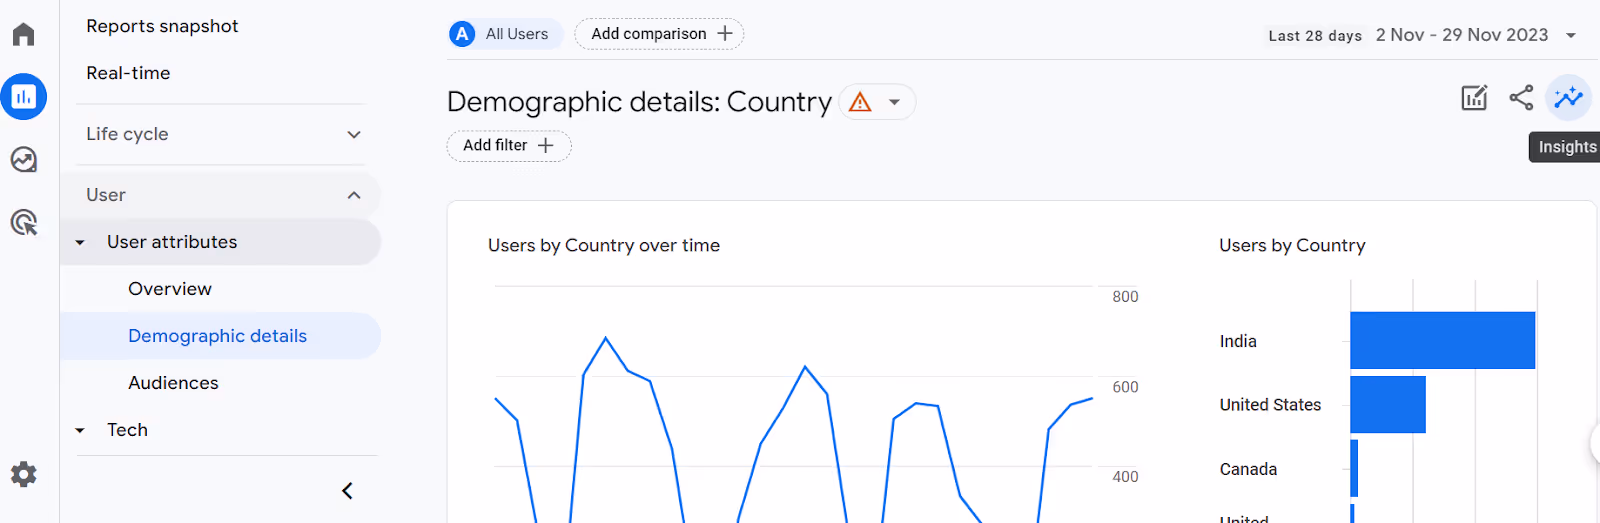
The Audiences report allows segmentation of users based on specific criteria like demographics, behaviors, or custom parameters. These insights enable personalized marketing and content strategies that resonate with target groups, driving better engagement and conversion rates.
Tech
The Tech subsection in GA4 provides detailed information on the technology users employ to interact with your website or app. The Tech Details report covers device types, operating systems, and browsers, offering valuable insights into user preferences and potential technical barriers.
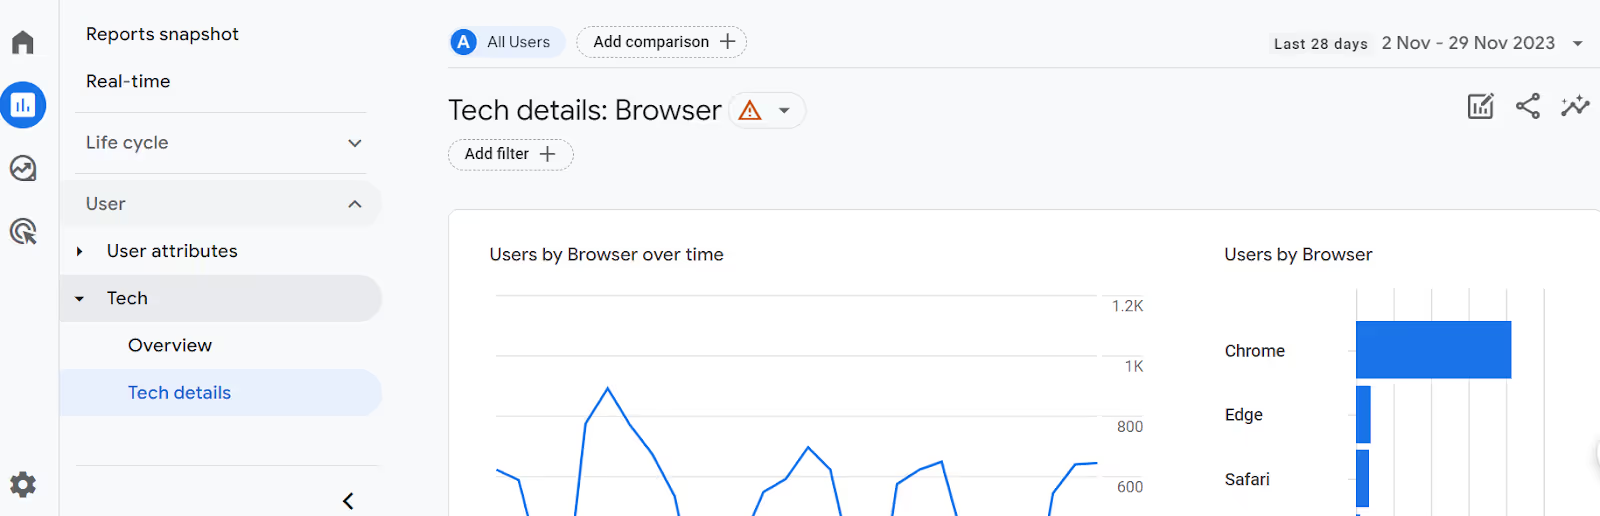
This data helps optimize website performance, ensuring device compatibility and improving user experience. By understanding the tech stack of your audience, businesses can create a responsive environment that aligns with user expectations and technical capabilities.
Custom Standard Reports
Standard GA4 reports provide a solid starting point for analyzing your data. However, they may not always meet your specific requirements. For instance, you might need an additional metric, a different chart type, or a customized default dimension.
While these reports are functional, they may require adjustments to suit your needs perfectly. In such cases, customizing reports becomes essential. With the Editor role and appropriate permissions, you can customize standard GA4 reports to meet your needs better.
Here are the customization options available:
- Edit a Report: Modify dimensions, metrics, chart types, and layouts. Add or remove cards and apply filters.
- Create a Custom Report: Start from a predefined template or create a report from scratch.
- Add to a Collection: Include predefined or custom reports in existing or new collections.
- Create, Edit, and Publish Collections: Customize collections for your business, modify existing ones, and publish them to make them available in the Reports section.
These features make GA4 reports more relevant and actionable for your business goals.
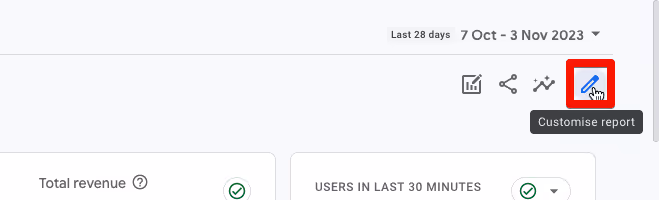
To customize a report, click the "Customize Report" button in the top-right corner of the report. You can add up to 16 cards for overview reports, while detailed reports allow changes to dimensions, metrics, and summary cards. Advanced users can explore the GA4 Report Library to create new reports or edit and publish collections tailored to their business objectives.
Exploration Reports
Exploration Reports in GA4 offer advanced data analysis tools, enabling you to go beyond standard reports. These customizable reports allow you to analyze specific metrics and dimensions in greater detail using funnel analysis, path exploration, and segment overlaps.
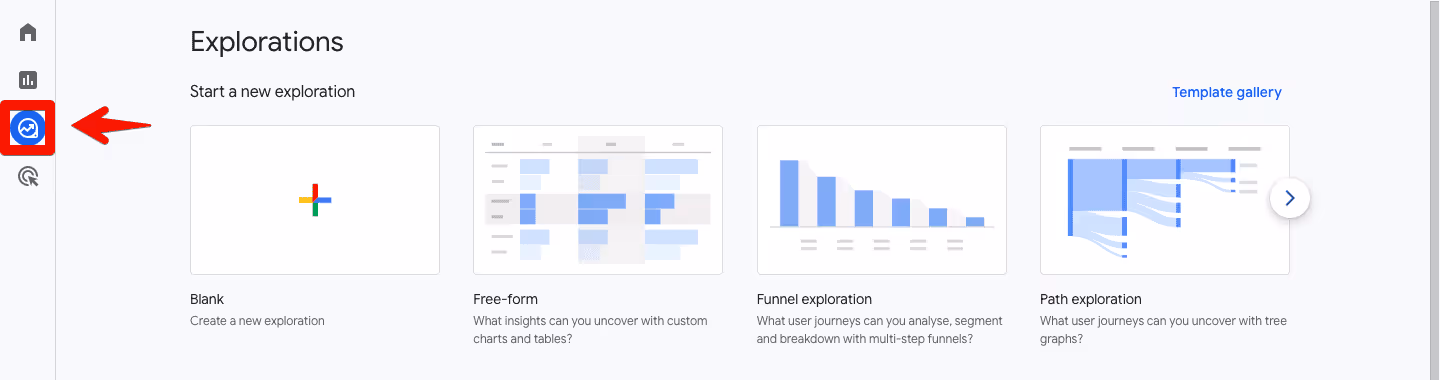
Accessible through the Explore tab, Exploration Reports provide flexibility to uncover hidden trends, patterns, and user behaviors. They’re ideal for businesses seeking deeper insights, answering complex questions, and making data-driven decisions tailored to unique goals.
Free-form exploration
Free-form explorations in GA4 are the most versatile exploration tools, acting as a blank canvas for your data. You can drag and drop metrics and dimensions to create custom reports, ranging from simple tables to detailed cross-tabs. Visualize data as tables or charts, compare metrics, apply segments and filters, or create nested rows for grouped analysis.
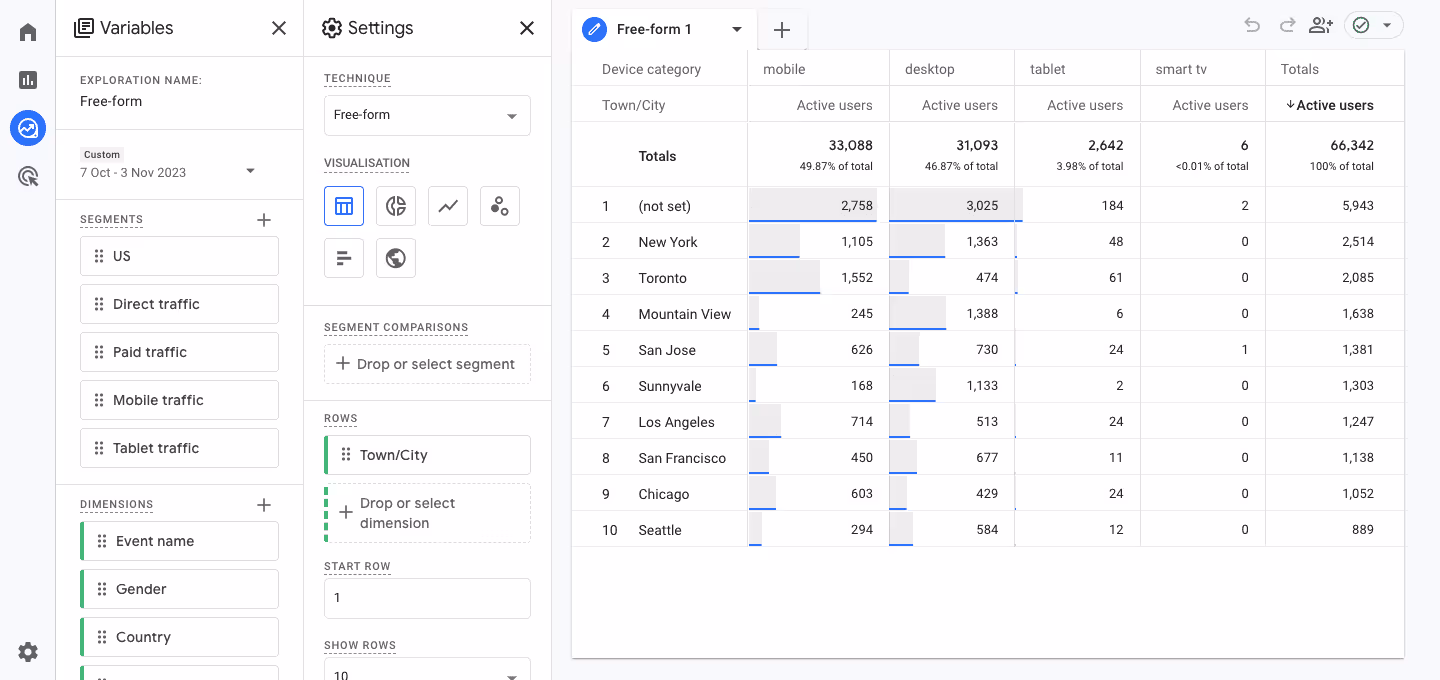
This tool is ideal when predefined reports don’t meet your needs, offering complete flexibility to tailor reports and gain insights specific to your business.
Cohort exploration
Cohort exploration analyzes groups of users who share common characteristics or experiences within a specific period. Acquisition dates, triggered events, transactions, or conversions can define these cohorts. GA4 allows you to analyze these groups daily, weekly, or monthly, helping track marketing campaign effectiveness or long-term user engagement.

This tool provides businesses with insights into user lifecycle and retention, enabling them to evaluate the success of interventions like product launches or redesigns by monitoring behavior over time.
Funnel exploration
The Funnel exploration tool visualizes user journeys through desired paths, such as signing up, making purchases, or engaging with content. It highlights where users drop off or progress, helping identify friction points.
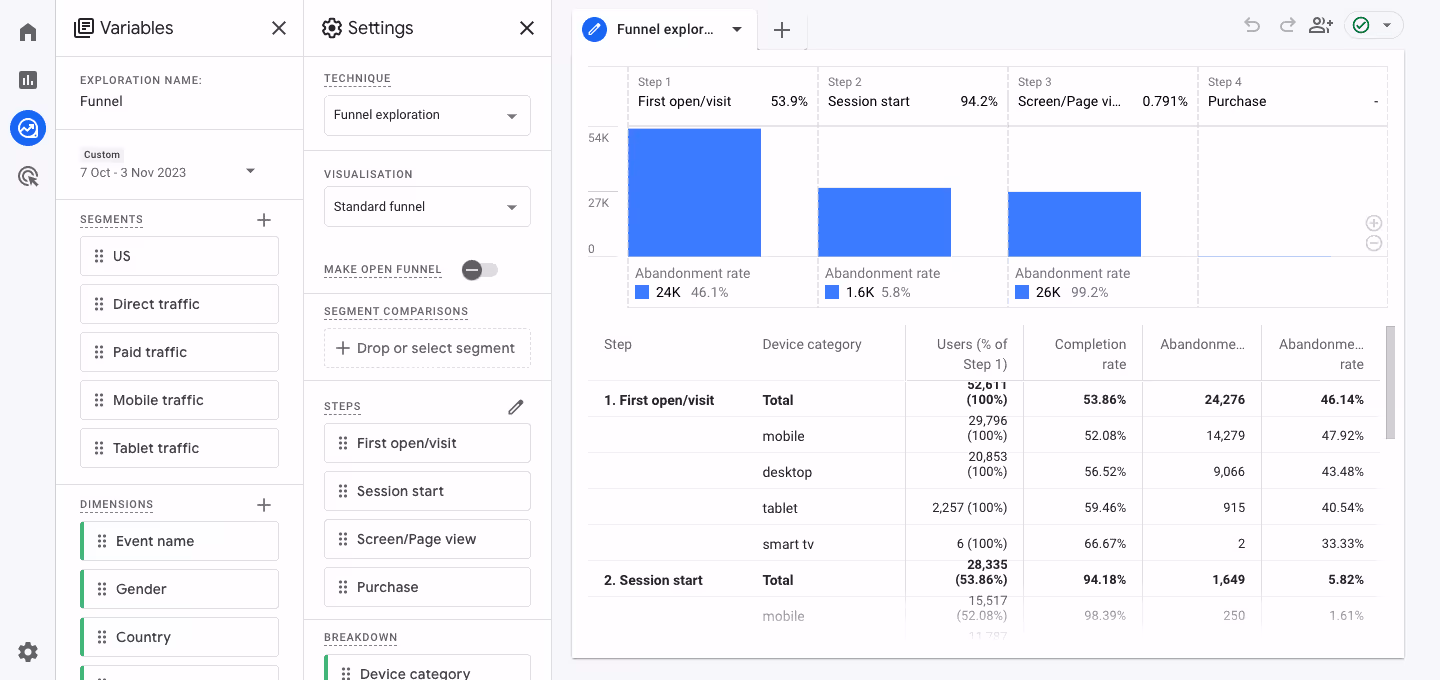
Businesses can use this data to optimize the user experience, ensuring smoother navigation and improved conversions. By analyzing over- or under-performing audiences, you can refine strategies to achieve desired user actions, enhancing engagement and success rates for your goals.
Segment overlap
The Segment Overlap tool in GA4 compares up to three user segments to identify overlaps and shared characteristics. This analysis helps discover new user groups, refine audience targeting, and uncover cross-selling or upselling opportunities.
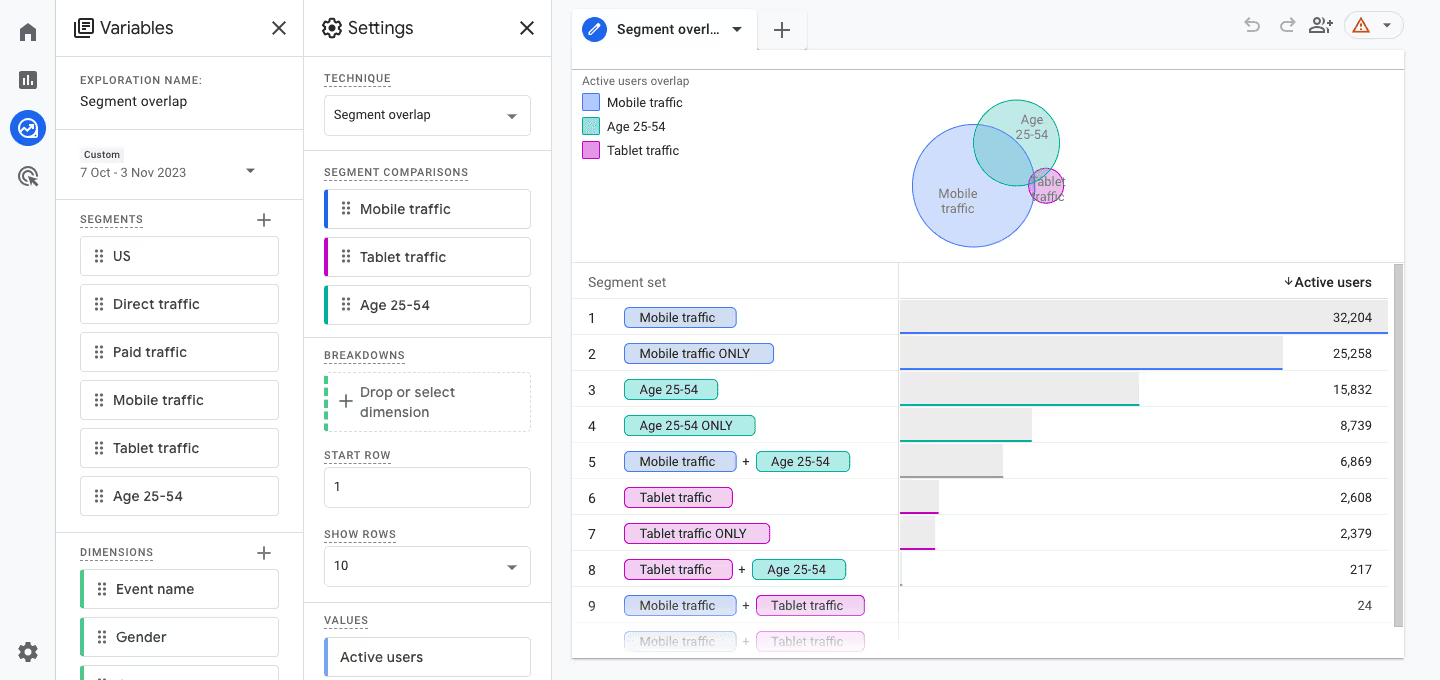
It’s a powerful tool for marketers targeting shared interests or improving campaign precision. Businesses can optimize their strategies for better engagement and revenue generation by understanding segment intersections.
User lifetime report
The User Lifetime report analyzes user behavior and value over their entire lifecycle. It provides insights into metrics like purchase history, churn probability, and campaign effectiveness.
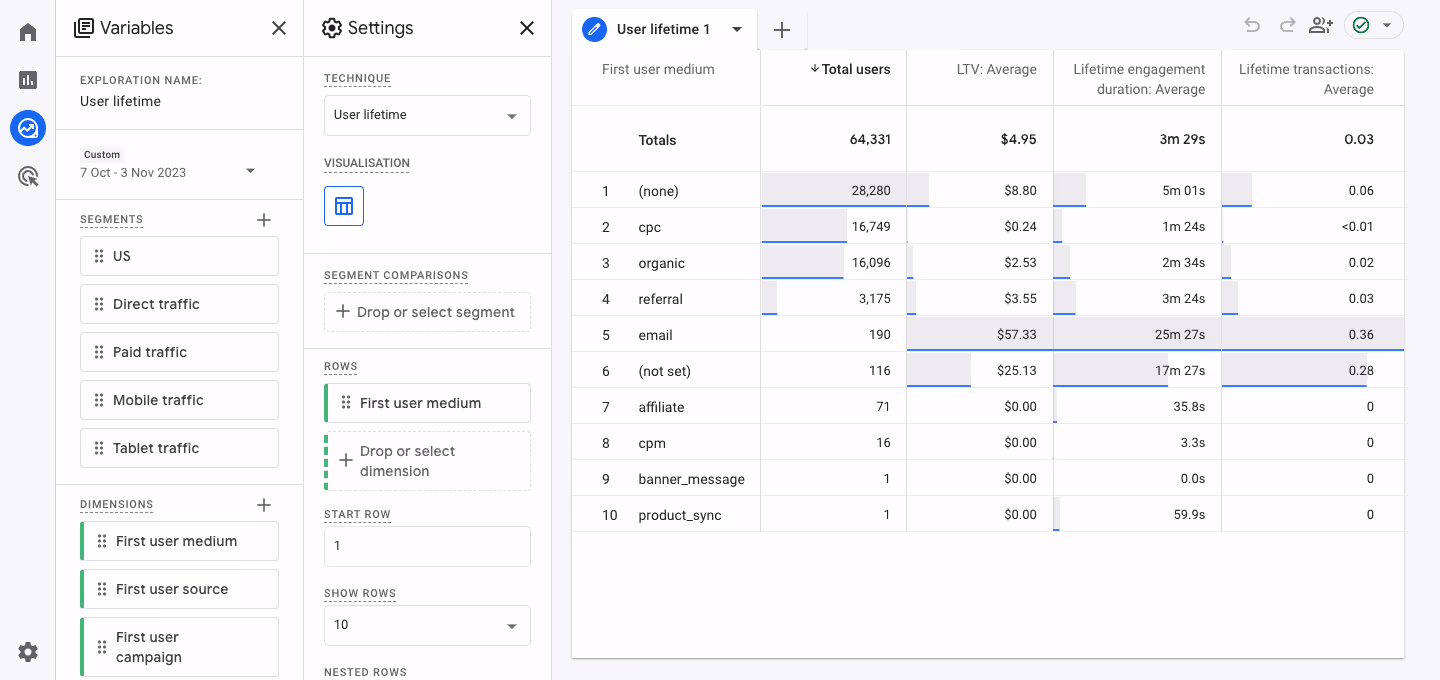
This report helps identify high-value campaigns, long-term customer trends, and retention strategies. Businesses can use it to understand user engagement patterns, ensuring efforts focus on acquiring and retaining the most valuable customers for sustainable growth and loyalty.
Path exploration
Path exploration visualizes user navigation through your website or app, helping you identify popular sequences, looping behaviors, or potential friction points. Use this tool to uncover how users move between pages, find top-performing content, and optimize navigation paths.
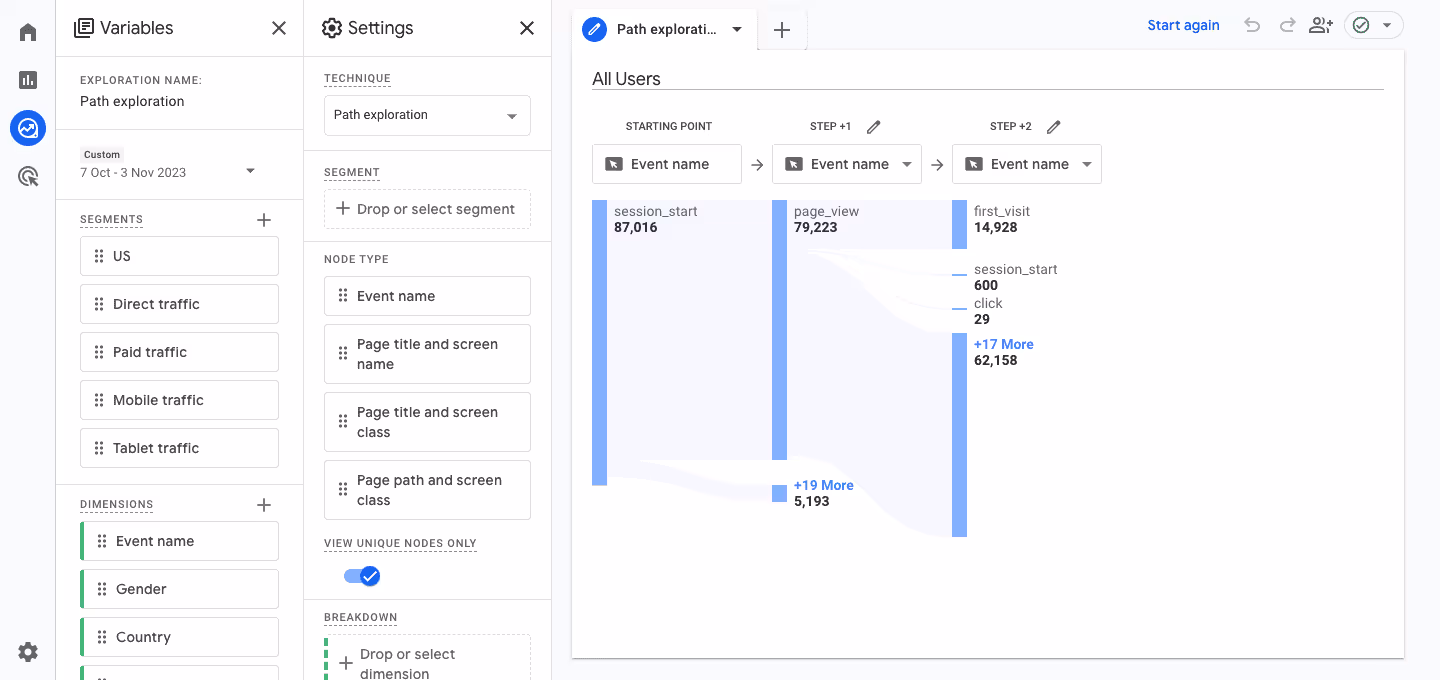
It’s ideal for ensuring users can locate desired information or products efficiently, improving overall satisfaction and engagement. Businesses can also pinpoint areas for improvement to enhance user flows.
User exploration
User exploration is similar to path exploration, which delves into individual user journeys, providing a detailed view of their interactions on your site or app.
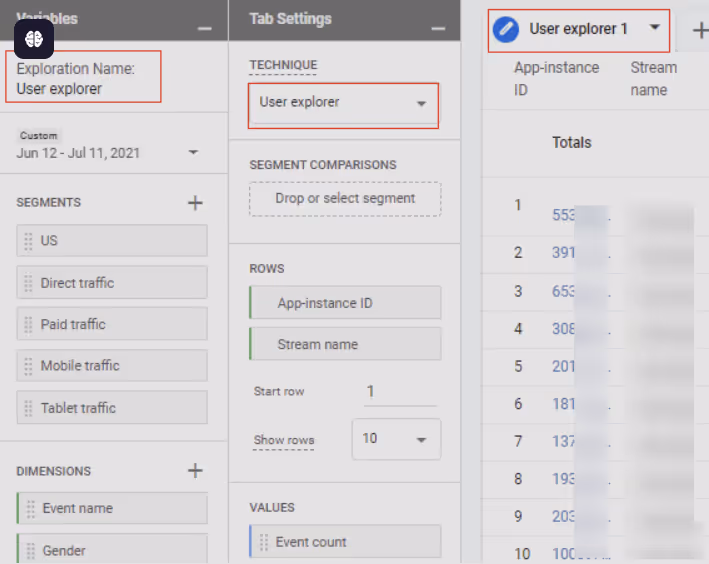
This report is essential for personalizing user experiences, understanding specific behaviors, or troubleshooting navigation issues. Businesses can analyze user-specific data to refine A/B testing strategies, evaluate the impact of personalized content, or resolve user flow challenges.
Attributes and Metrics to Track in Reports for E-commerce Business
Tracking the right attributes and metrics in GA4 reports is crucial for e-commerce success. These insights help monitor user behavior, product performance, and revenue generation.
Revenue Reports
Revenue Reports in GA4 provide insights into your e-commerce earnings, including total revenue, average order value, and transaction details. These reports help identify top-performing products, successful campaigns, and customer purchasing patterns. Businesses can optimize pricing, promotions, and inventory to maximize profitability and growth by analyzing this data.
Product performance in e-commerce purchase reports
The E-commerce Purchases Report in GA4 provides a detailed view of individual product performance, helping businesses understand which products succeed and which need improvement.
- Attribute: Tracks product views, add-to-cart actions, and completed purchases.
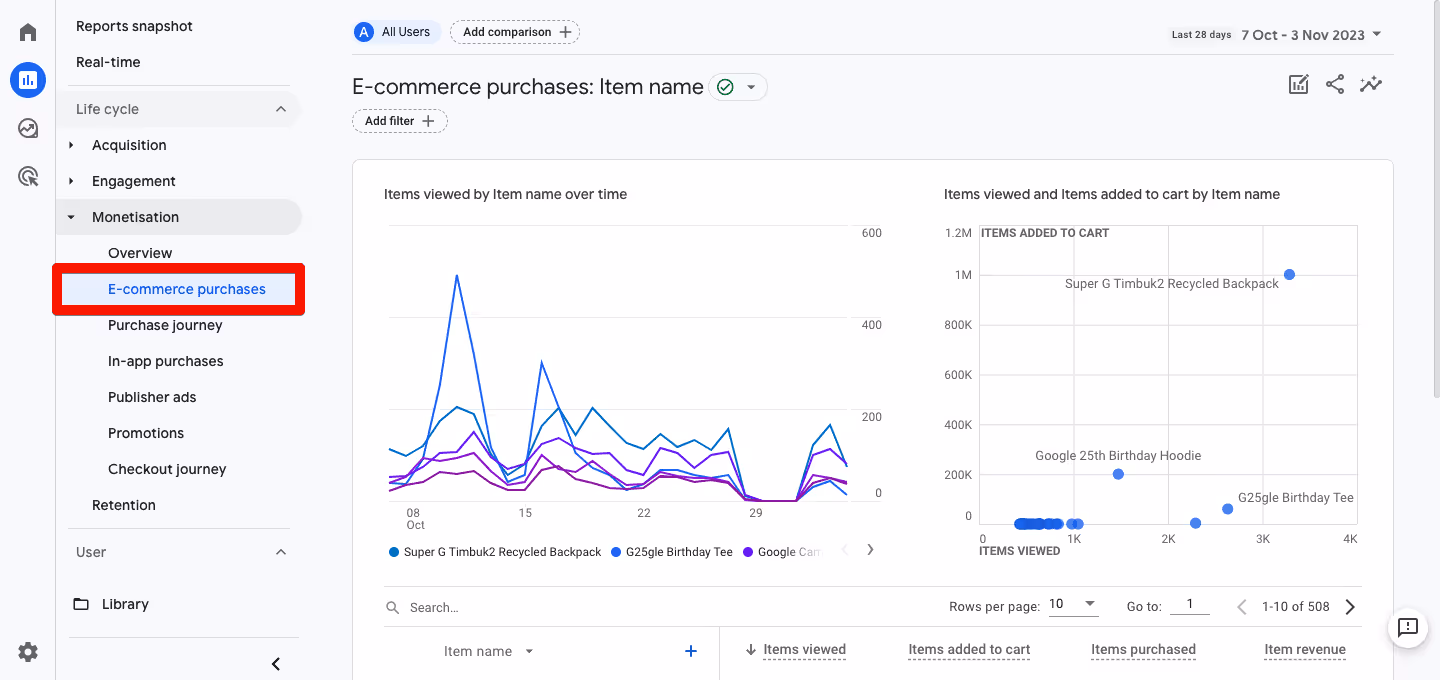
- Metrics:
- Items Viewed: Number of times a product was viewed.
- Items-added-to-cart: Count of times users added a product to their cart.
- Item Revenue: Total revenue generated from product sales, minus refunds, and excluding tax and shipping.
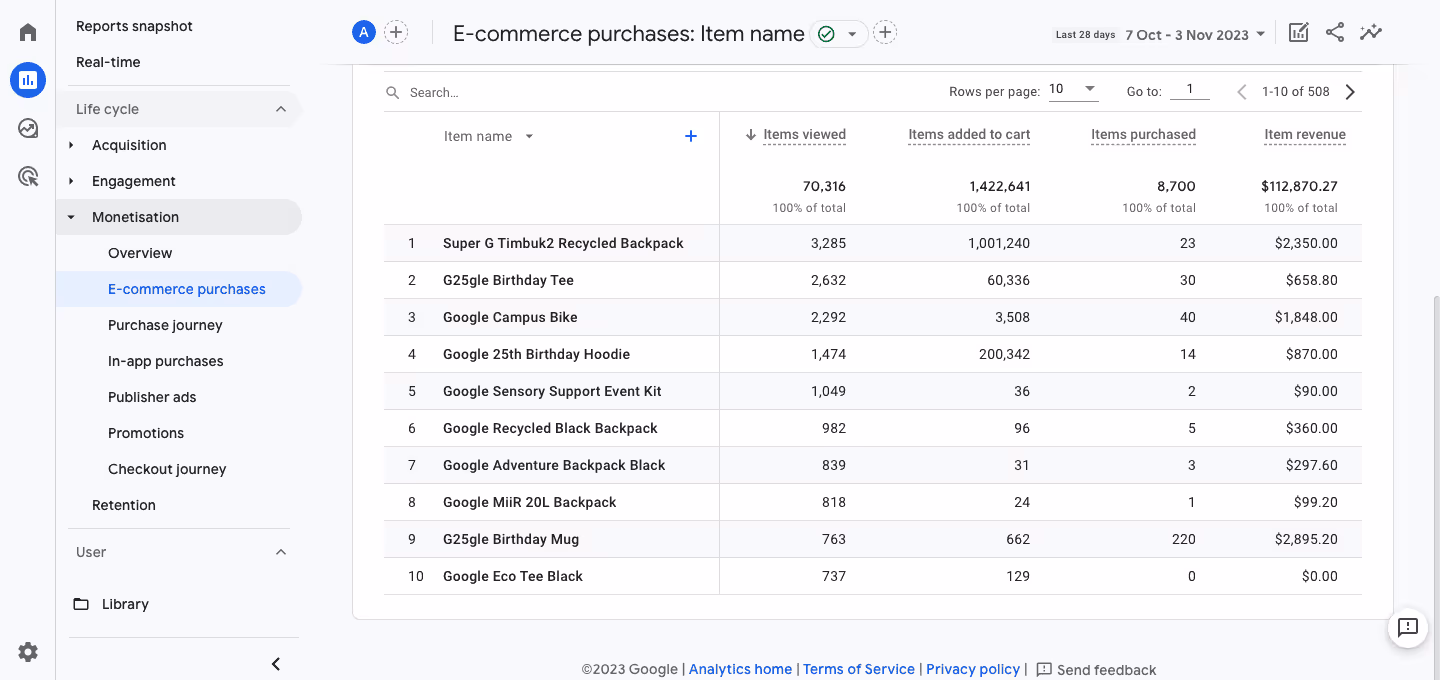
This data enables businesses to refine marketing, optimize inventory, and enhance product strategies for better performance and profitability.
Transaction data in monetization overview reports
The Monetization Overview Report in GA4 summarizes transaction trends, offering insights into revenue, purchase quantities, and order values.
- Attribute:
- Tracks overall transaction trends, including revenue, purchase quantities, and average order values.
- Metrics:
- Total Revenue: Total monetary value of transactions.
- Quantity: Number of products sold in transactions.
- Average Purchase Revenue: Revenue divided by the number of transactions.
This report provides a high-level view to help businesses analyze sales performance and adjust strategies accordingly.
Advertising Reports
Advertising Reports in GA4 provide essential insights for evaluating the performance of PPC campaigns, display ads, and retargeting efforts. These reports help track metrics like impressions, clicks, and conversions, enabling businesses to optimize ad spend and identify effective channels for driving traffic, engagement, and revenue growth.
Source/Medium report in user acquisition reports
The Source/Medium Report in GA4 identifies where your traffic originates, such as organic search, paid ads, or referrals, by analyzing first-user source/medium data.
- Attribute: Tracks traffic origins to evaluate channel effectiveness.
- Metrics:
- Sessions by Source/Medium: Number of sessions grouped by traffic source and medium.
- Engagement Rate by Source/Medium: Percentage of sessions with user engagement.
These insights help refine ad spend and strategies by comparing the performance of different channels, such as Facebook vs. Google Ads.
Campaign performance
The Campaign Performance Report in GA4 evaluates ad performance across platforms to measure campaign success.
- Attribute: Tracks campaign metrics for insights into ad effectiveness.
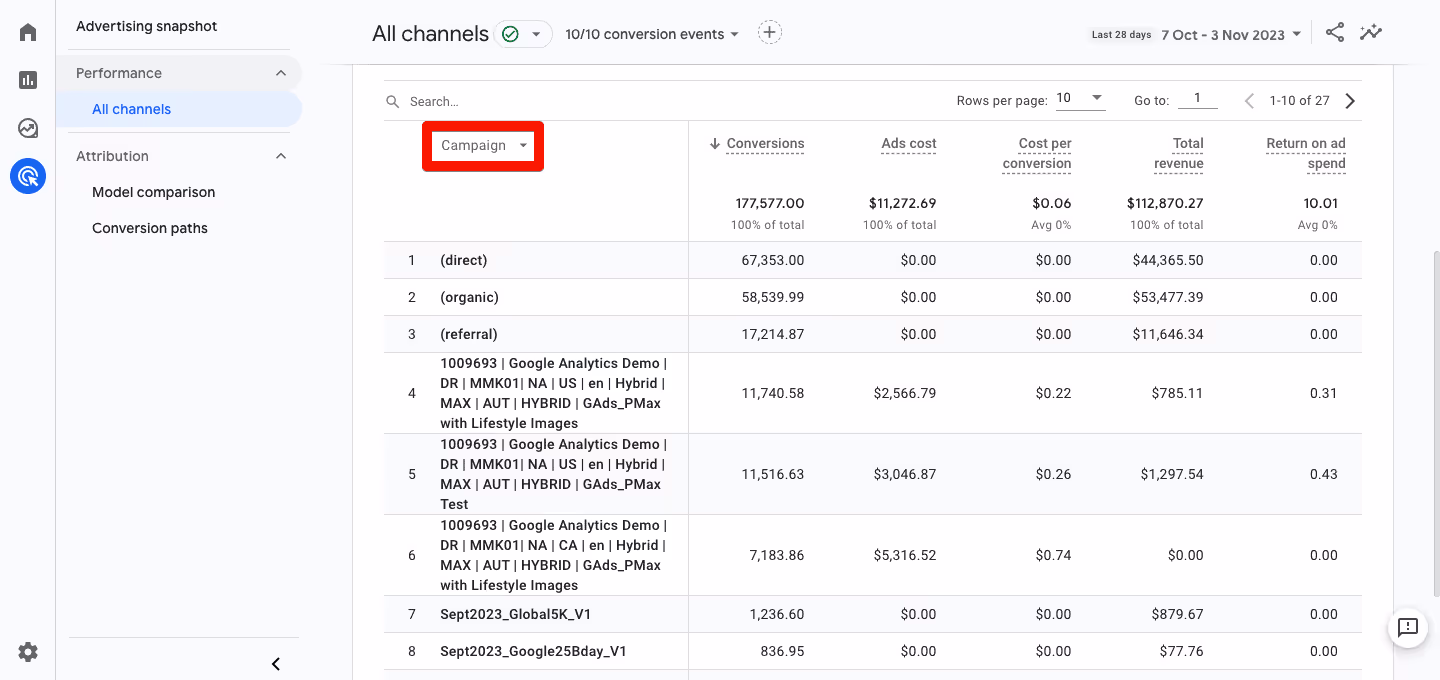
- Metrics:
- Key Events: Number of desired actions (e.g., purchases, clicks).
- ROI (Return on Investment): Revenue generated compared to ad spend.
- Cost Per Acquisition (CPA): Cost incurred to acquire a customer.
This report helps businesses identify high-ROI campaigns and refine strategies to optimize advertising efforts.
Ad destination report in landing page report
The Ad Destination Report in GA4 analyzes the effectiveness of landing pages used in ad campaigns. It provides insights into how well landing pages convert ad traffic and engage users.
- Attribute: Tracks landing page performance in ad campaigns.
- Metrics:
- Landing Page Sessions: Number of sessions starting on a specific page.
- Conversion Rate on Landing Pages: Percentage of users completing desired actions.
- Bounce Rate: Percentage of users exiting without interaction.
This report helps businesses identify top-performing landing pages and highlights areas needing optimization, such as pages with high bounce rates.
Attributes and Metrics in GA4 Reports for SEO
Understanding key attributes and metrics in GA4 is essential for improving your website's SEO performance. GA4 provides detailed insights into traffic sources, user engagement, and search behavior.
Google Search Console
Google Search Console integration with GA4 enhances your SEO analysis by connecting search performance data with user behavior insights. It provides deeper visibility into how users arrive at your site through search queries and helps identify high-performing keywords, underperforming pages, and content opportunities.
Queries report
The Queries Report in GA4 focuses on the search terms users enter to find your website organically.
- Attribute:
- Tracks organic search queries leading to your site.
- Metrics:
- Impressions: Number of times your site appeared in search results.
- Clicks: Number of times users clicked on your site from search results.
- Click-Through Rate (CTR): Percentage of impressions resulting in clicks.
This report helps align SEO strategies with user search behavior and identifies high-performing queries.
Clicks, impressions, and CTR in Google organic search traffic report
Understanding how your site performs in search results is crucial for refining your SEO strategy. The Google Organic Search Traffic Report provides detailed insights into these metrics.
- Attribute:
- Provides insights into organic search performance, broken down by landing page and query string.
- Metrics:
- Clicks: Number of users clicking on your site from search results.
- Impressions: Times your site appeared in search results.
- Click-Through Rate (CTR): Ratio of clicks to impressions, indicating how engaging your listing is.
These metrics help evaluate search visibility, user interest, and the effectiveness of titles and meta descriptions.
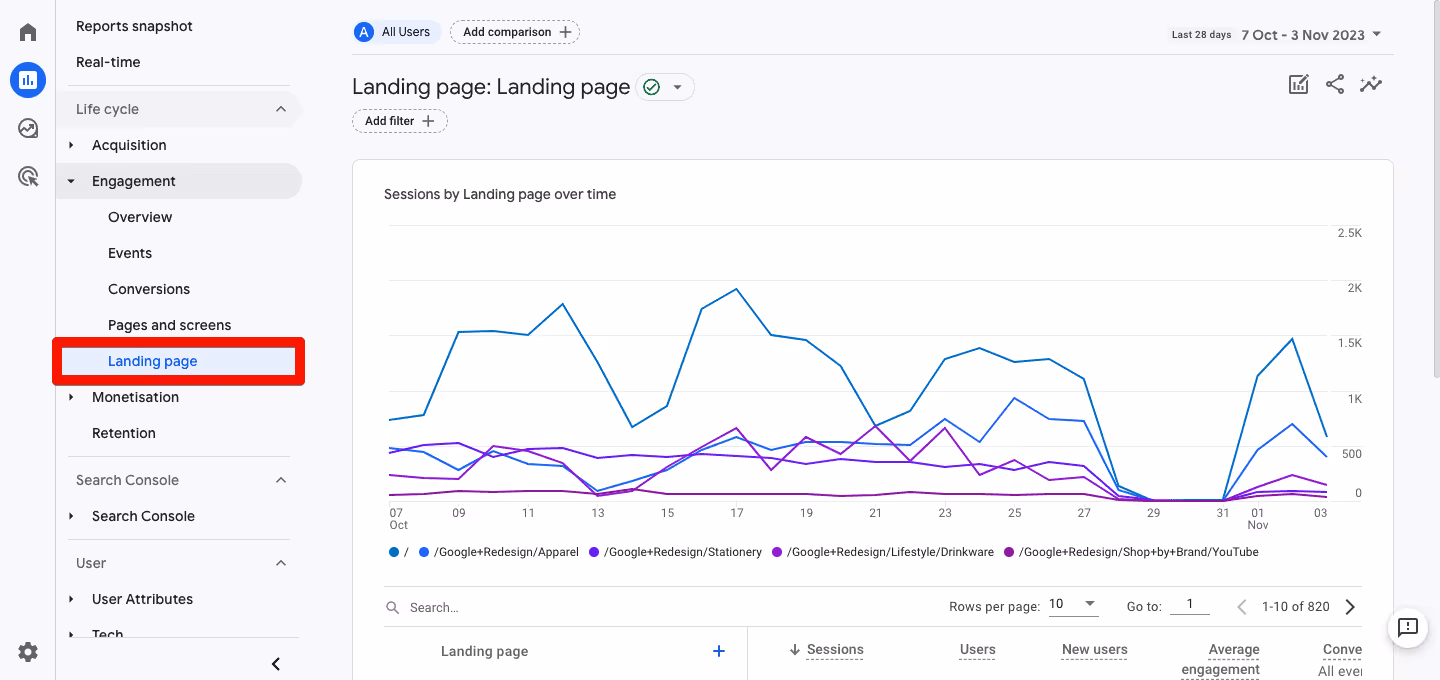
Landing Pages in Landing Page Report
Landing pages are the entry points, attracting the most organic traffic to your site. Found in the Landing Page Report within Engagement Reports or Search Console Reports.
- Attribute:
- Tracks pages that attract the most organic traffic.
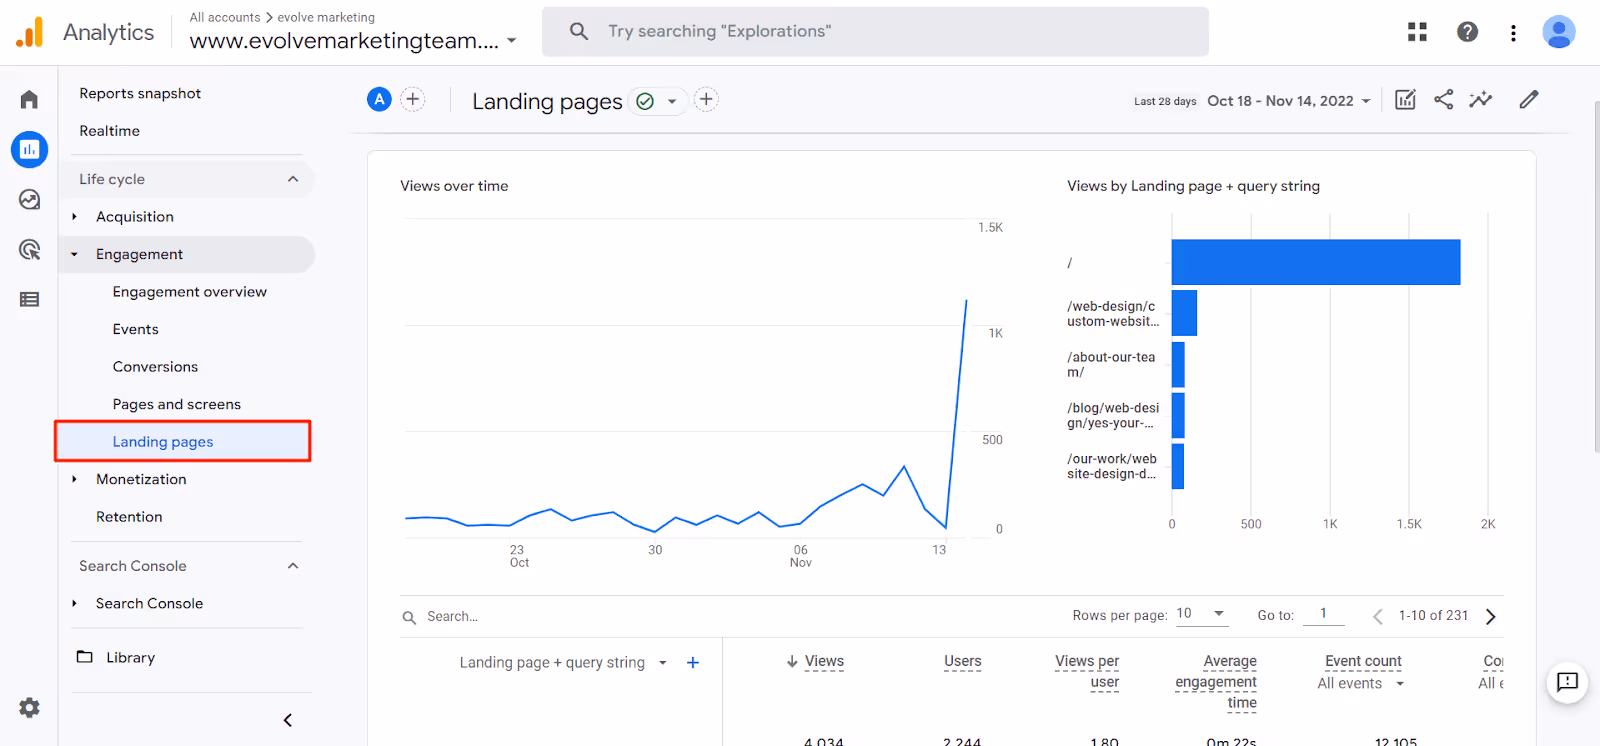
Metrics:
- Landing Page Sessions: Number of sessions starting on a specific page.
- Bounce Rate: Percentage of users leaving without further interaction.
- Key Events: Actions completed by users, such as purchases or signups.
This data helps identify high-performing content and optimize underperforming pages.
Device Categories in Tech Details Report
Understanding which devices users access your site with is vital for optimizing their experience. The Tech Details Report in GA4 provides this data, offering insights into user preferences across device types.
- Attribute:
- Tracks device types (mobile, tablet, desktop) used to access your site.
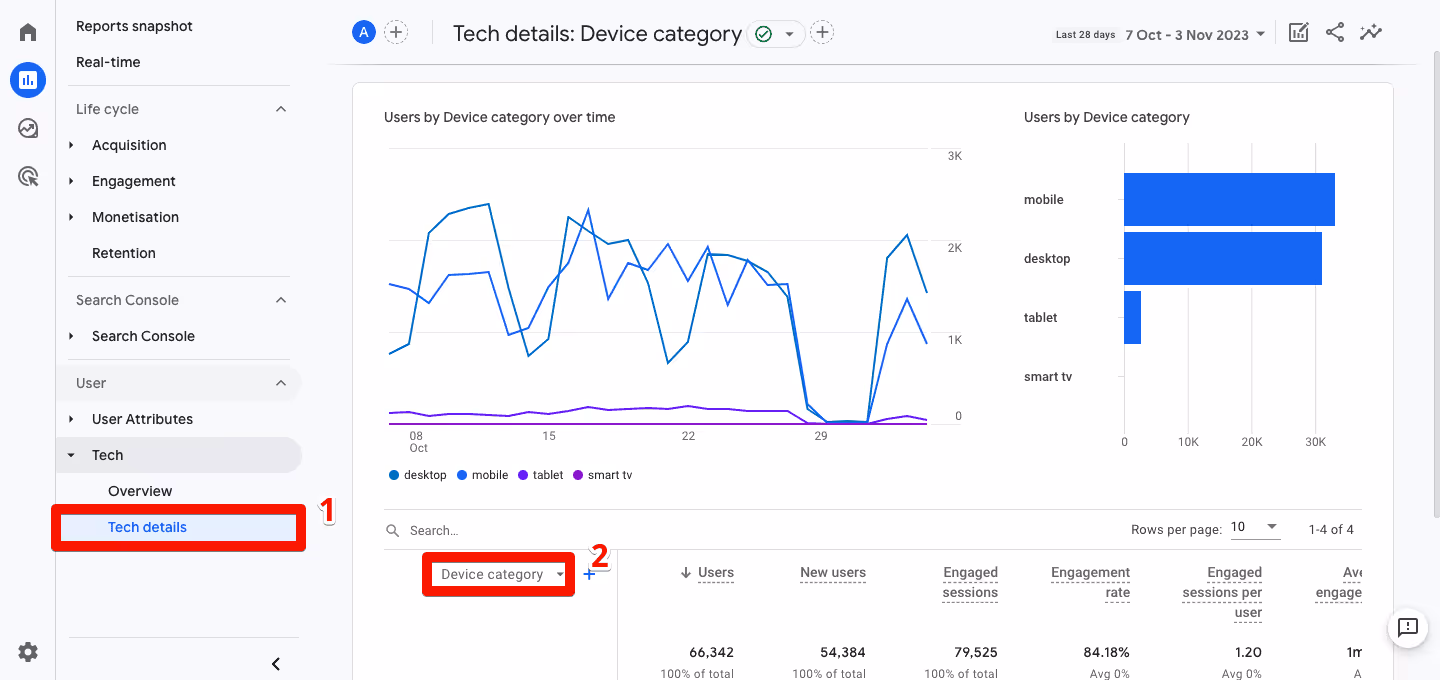
- Metrics:
- Sessions by Device Category: Number of sessions from each device type.
- Engagement Rate by Device: Percentage of sessions with active engagement.
- Key Events by Device: Completed actions by device type.
These metrics guide device-specific optimizations for better performance.
Acquisition Reports
Acquisition Reports in GA4 provide insights into traffic sources such as organic search, referrals, and channels. These reports help identify trends and optimization opportunities, offering a broader perspective on user acquisition.
Source/medium report in traffic acquisition reports
The Source/Medium Report in GA4 helps analyze where your website traffic originates and how different sources and mediums perform.
- Attributes:
- Represents traffic sources with mediums (e.g., organic search, referral traffic, direct visits).
- Found in the Traffic Acquisition Report with the primary dimension set to Session Source/Medium.
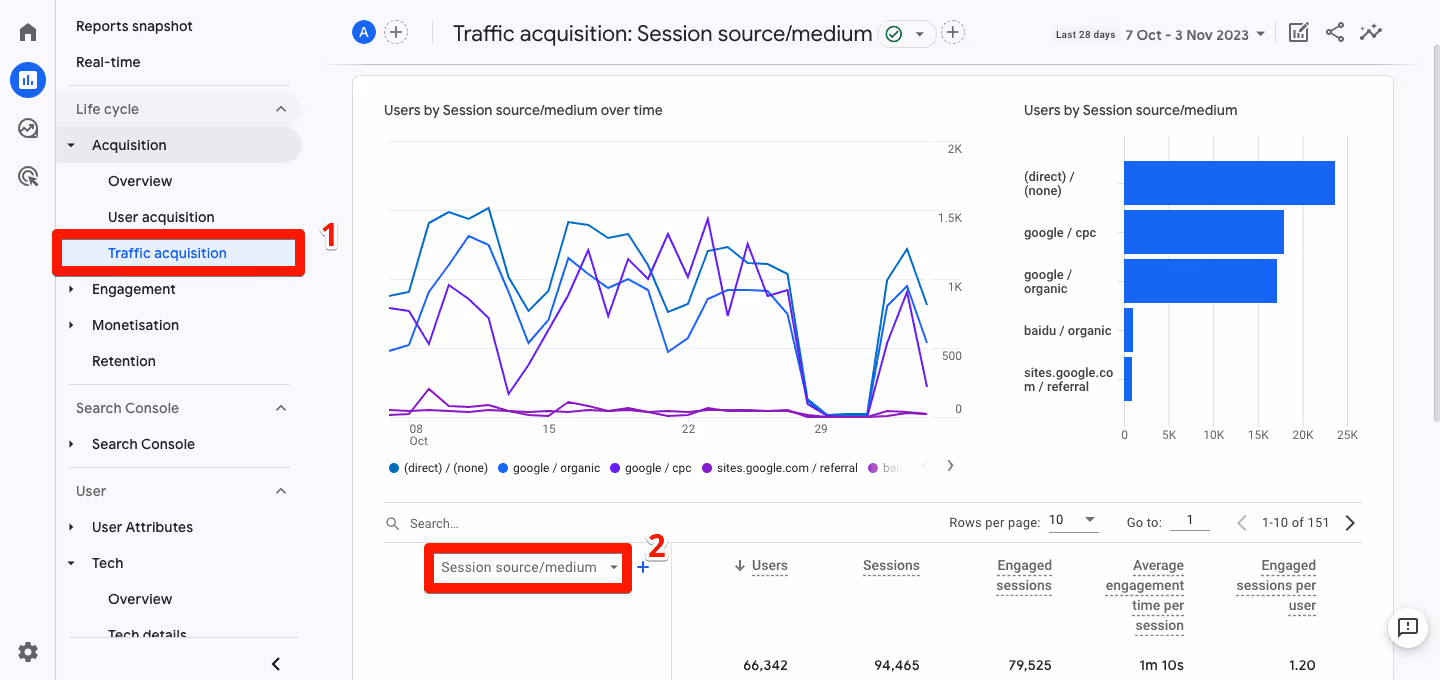
- Metrics:
- Sessions by Source/Medium: Number of sessions grouped by source/medium.
- Engagement Rate by Source/Medium: Percentage of engaged sessions for each source/medium.
- Key Events by Source/Medium: Actions completed per source/medium.
Referral traffic in the traffic acquisition report
Referral traffic represents visitors arriving at your site from external websites linking to your content. It helps identify link-building opportunities and understand content resonance.
- Attributes:
- Tracks traffic from external sites linking to yours.
- Found in the Traffic Acquisition Report with filters or the dimension Session Default Channel Group.
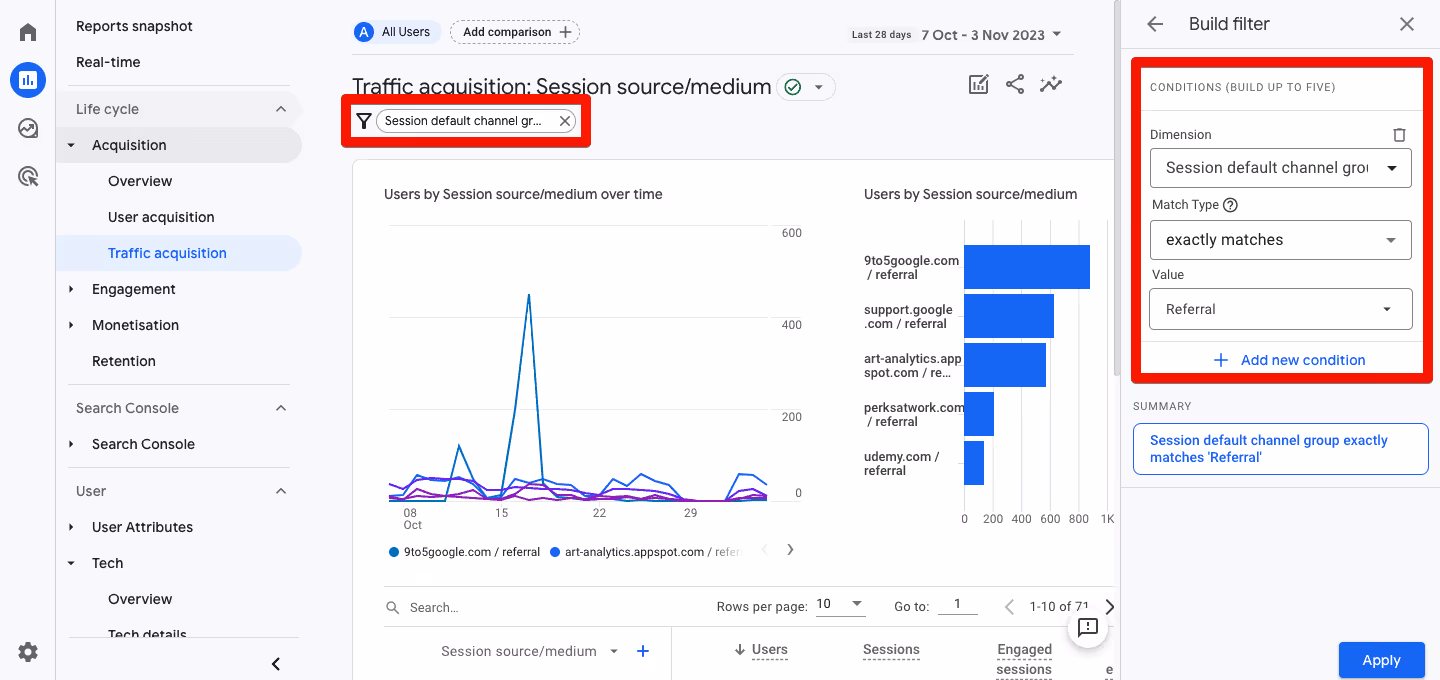
- Metrics:
- Referral Sessions: Number of sessions originating from external sites.
- Engagement Rate: Percentage of engaged sessions from referrals.
- Key Events: Completed actions attributed to referral traffic.
These insights are vital for optimizing partnerships and enhancing referral strategies.
Organic search traffic in the traffic acquisition report
Organic search traffic represents users who find your website through search engines, providing insights into your SEO performance and visitor behavior.
- Attributes:
- Tracks traffic originating from search engines.
- Found in the Traffic Acquisition Report with filters or the dimension Session Default Channel Group set to "Organic Search."
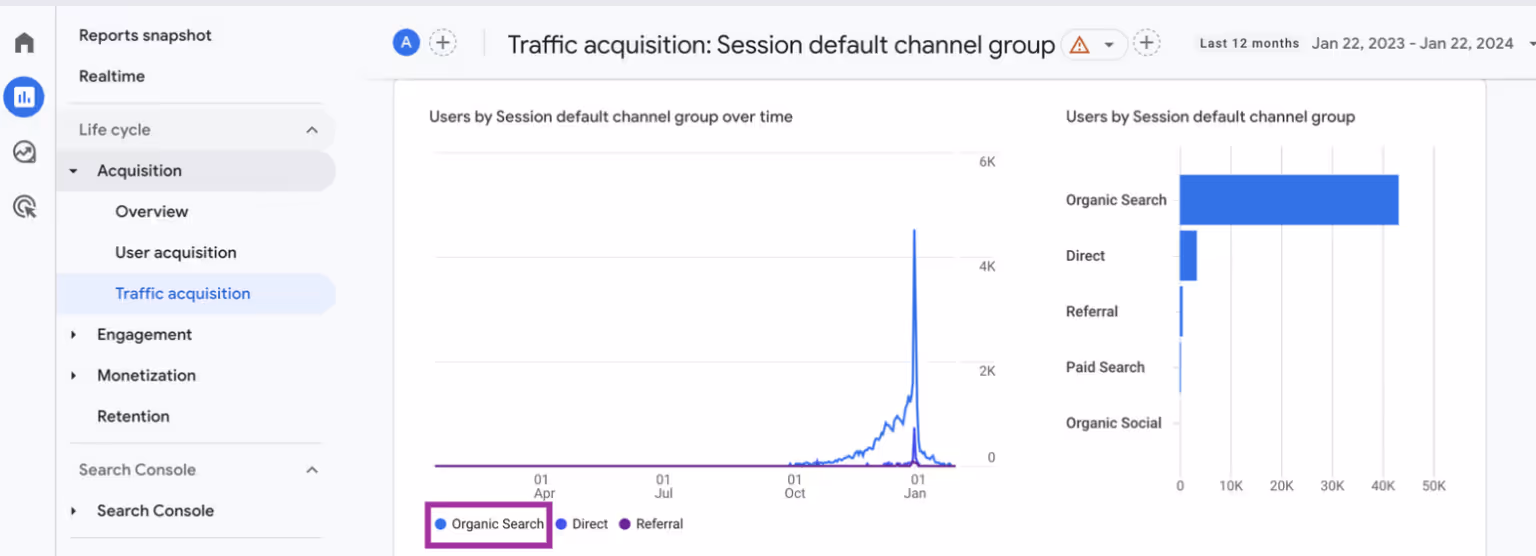
- Metrics:
- Organic Sessions: Number of sessions from search engine traffic.
- Session Duration: Average time users spend on your site.
- Pages per Session: Number of pages viewed per session.
These metrics help evaluate organic visitor quality and guide SEO optimization efforts.
Channels in the traffic acquisition report
The Channels Report in GA4 provides insights into how traffic sources, such as organic search, paid search, social media, and email, perform.
- Attributes:
- Tracks traffic sources grouped by channels (e.g., organic, paid, social, email).
- Found in the Traffic Acquisition Report with the dimension Session Default Channel Group or through custom channel groupings.
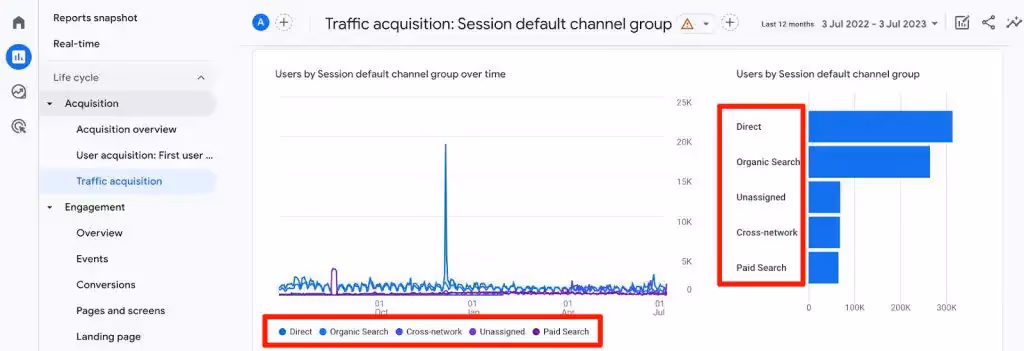
- Metrics:
- Sessions by Channel: Number of sessions for each channel.
- Engagement Rate: Percentage of sessions with active engagement per channel.
- Key Events by Channel: Completed actions attributed to each channel.
This data helps compare channel performance and refine marketing strategies.
Turn GA4 Reports into Actionable Insights with OWOX Data Marts
Google Analytics 4 gives you powerful tracking capabilities, but without clean, unified data, reports often stay siloed. With OWOX Data Marts, you can centralize GA4 data alongside ad platforms, CRM, and revenue sources in one governed model. Define your metrics once, ensure data accuracy, and deliver real insights directly to dashboards or Google Sheets.
Frequently asked questions


Finally, a tool that doesn't ask business users to learn a new dashboarding UI. Our marketing team already knows Sheets. OWOX just delivers the right data.
Joinable data marts concept was the thing that sold us. We can now use the semantic layer without building one.
Self-hosted the OSS version on Digital Ocean. Zero vendor lock-in. Contributed a Shopify connector back in week two.