
Data Sources connects the platforms your team actually uses to your warehouse. Analysts get raw data to model; business users get the governed outputs — all from the same pipeline.
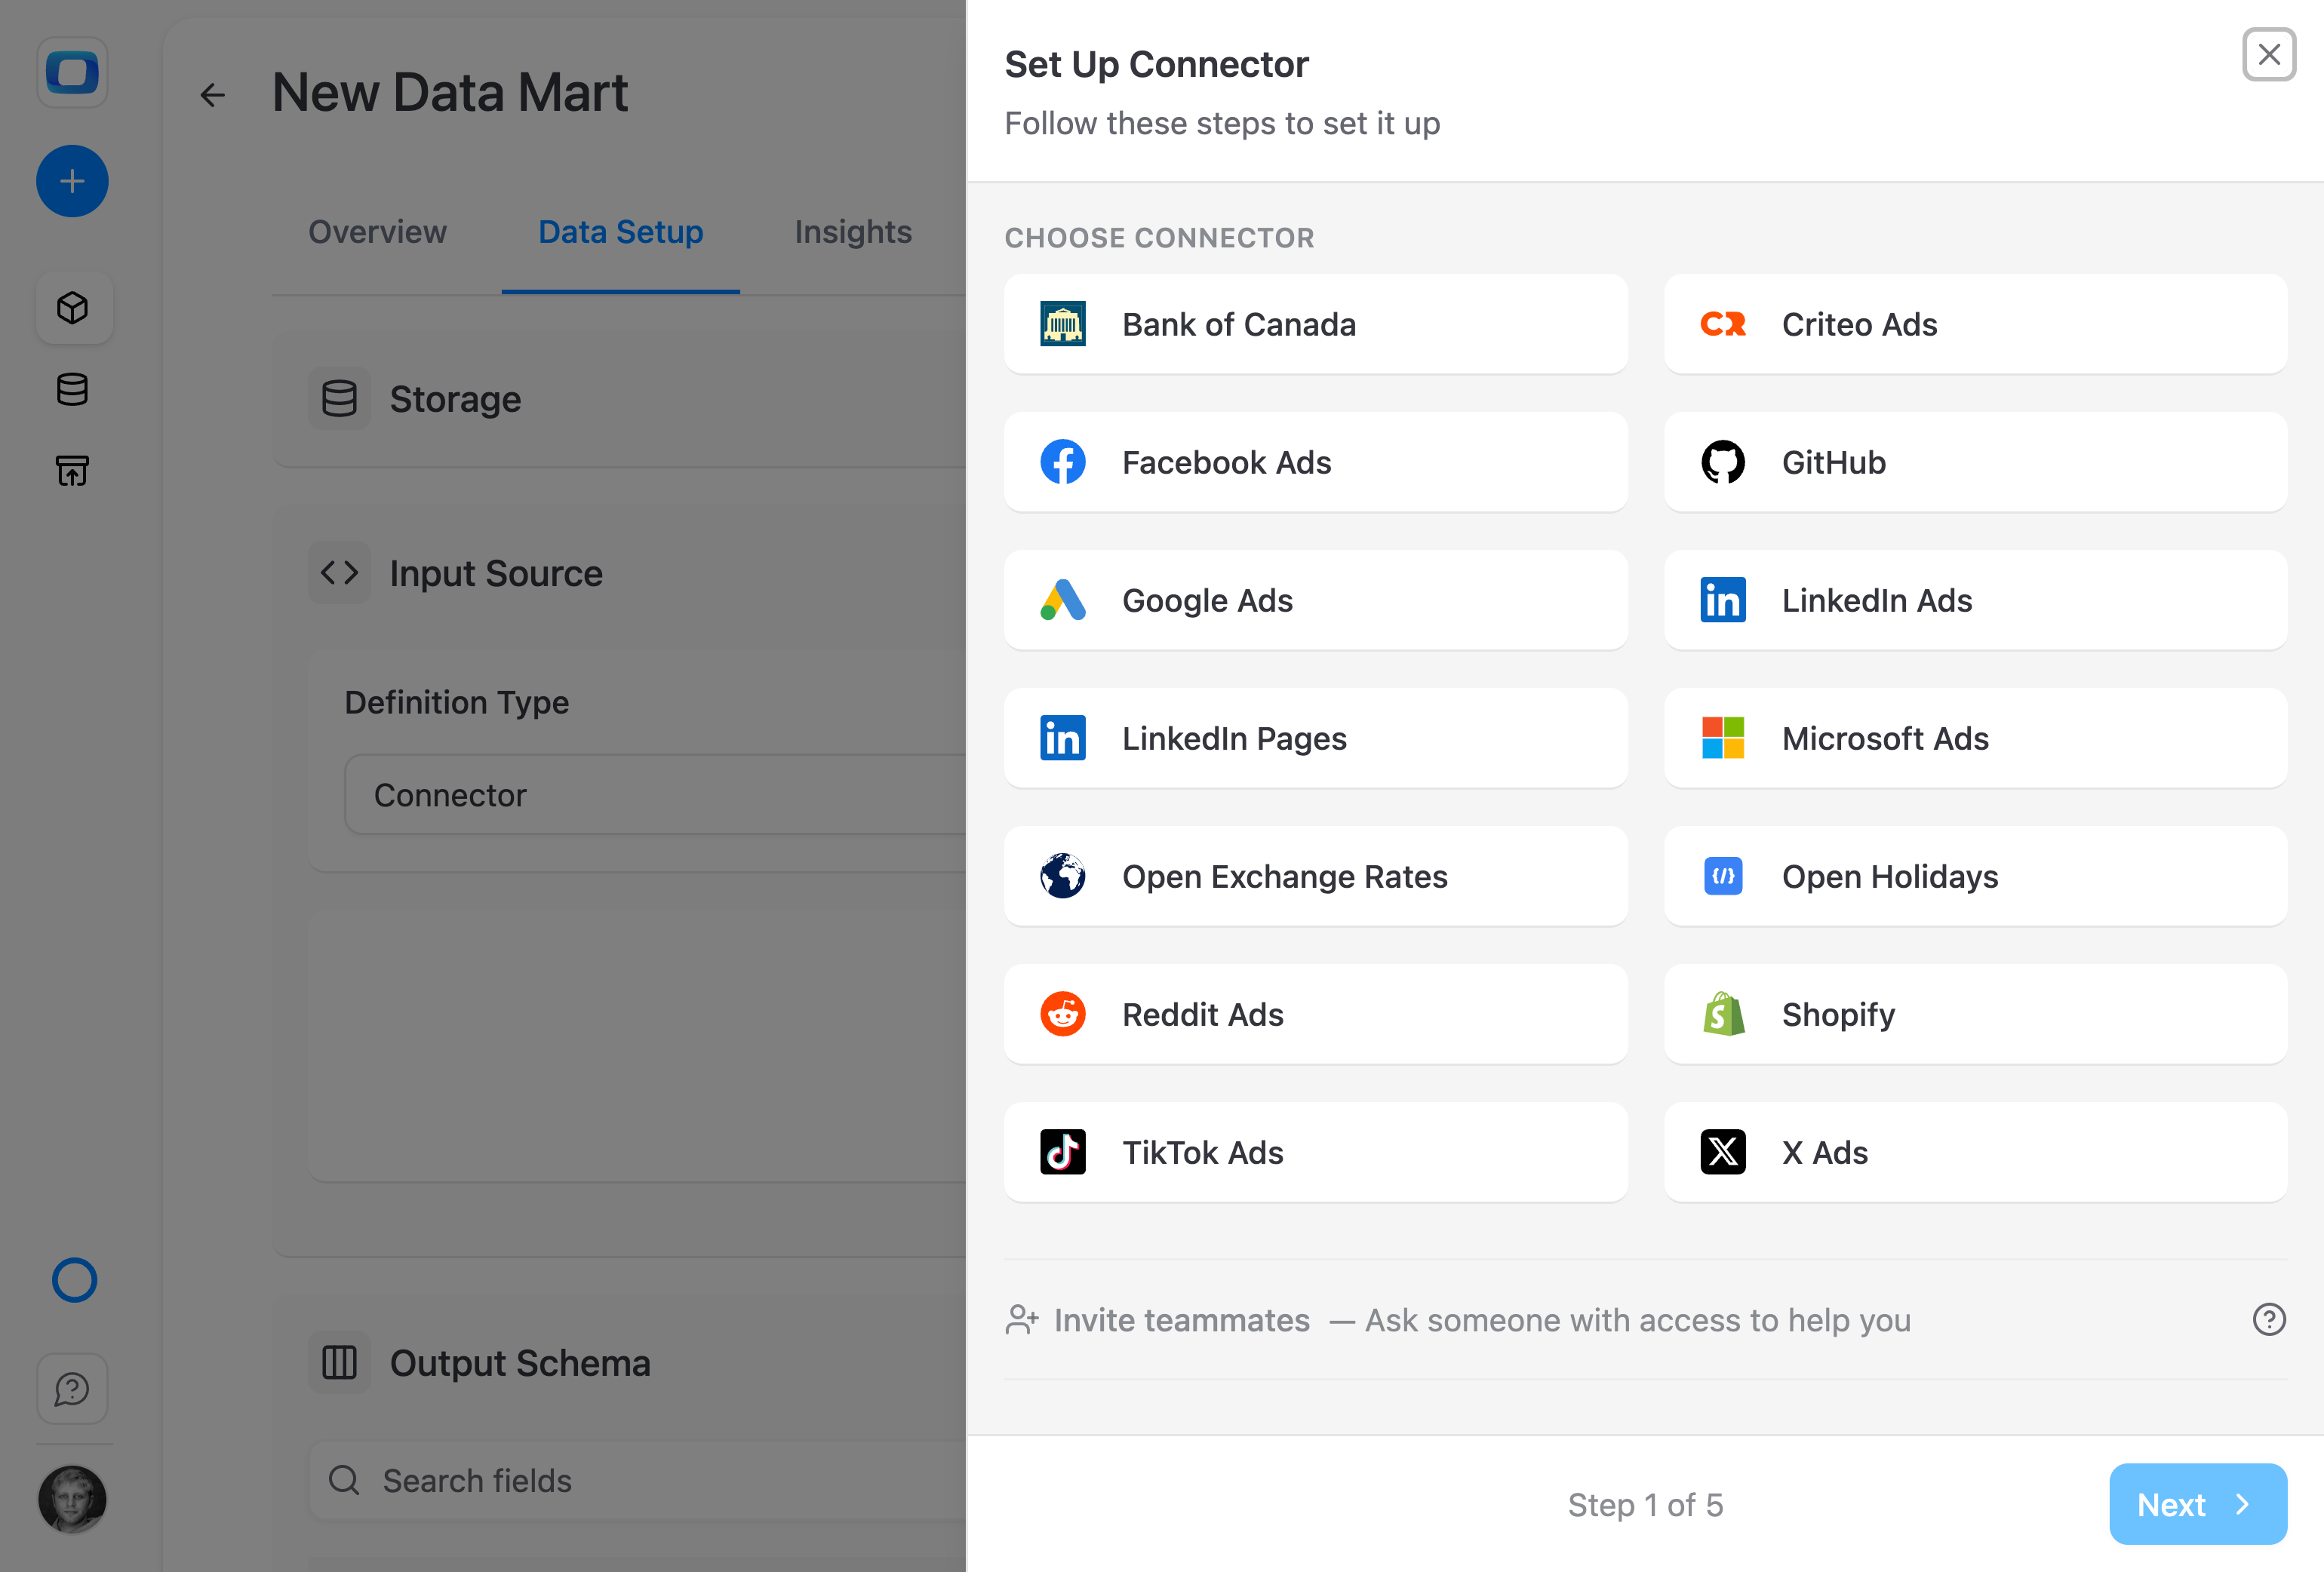
Connect the marketing platforms, CRMs, and business tools you actually use — with free, open-source connectors. No per-connector fees, no volume limits — data lands in your warehouse, under your control.
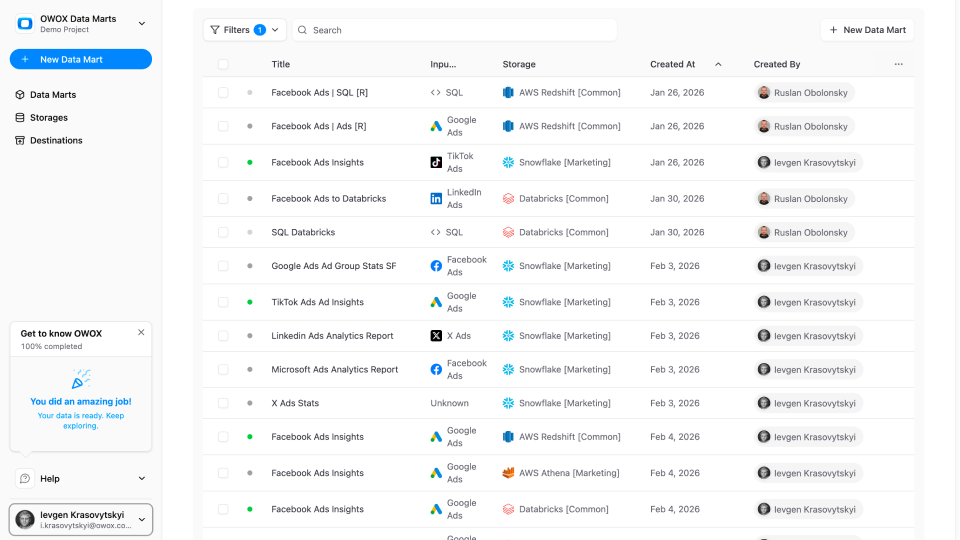
Once connected, data from every platform is blended into governed data marts. No more switching between ad platforms, CRMs, and spreadsheets — everything lives in one queryable layer.

Free, open-source connectors for marketing platforms, CRMs, and databases — data lands in your data warehouse, under your control.
Connect Google Ads, Meta, TikTok and more platforms to your warehouse. No per-connector fees, no volume limits.
Set hourly, daily, or custom sync intervals. Most connectors support incremental updates — so only relevant data gets pulled.

All connectors are open-source on GitHub. Fork an existing one, build from scratch, or contribute back to the community. No vendor lock-in, ever.

Once connected, data from every platform is blended into governed data marts – no more switching between 15 browser tabs.
Every platform — Google Ads, Meta, TikTok, your CRM — becomes accessible right from the Google Sheets UI. No more jumping between browser tabs.

Blended ad spend and CRM revenue land in Google Sheets, Looker Studio, or Slack — so you can finally answer "which channel drives pipeline?"

Wake up to a short summary of yesterday's spend, leads, and conversions — right where your team already talks.

Decide where do you want your data to be stored - any data warehouse
Choose your app, give necessary permissions to account.
Select the fields your want to import. You can get the fields available in the API.
You're ready to go. Run connectors & set update frequency.
You don't want single-source reports, right? Collect more data!
Build a collection of data marts: SQL, tables, views or connectors.
Select a data destination: Sheets, Looker Studio, Email or Chat tools.
Get focused on data insights, set delivery and forget about routine.
The easiest to get started
OWOX Cloud
Try before you scale
Starter
Free to start — paid plans from $65/mo
For data professionals & teams starting to automate entire business reporting in spreadsheets
MOST POPULAR
OWOX Cloud
Best for teams
Team
Starts at $875/mo + $35/seat (5 seats included)
For small and mid-size teams looking to automate collaborative reporting & get AI insights
OWOX Cloud
Ultimate control in the cloud
Enterprise
Custom contract - talk to our experts
For organizations looking for a tailored solution with an extra layer of flexibility, security & support included
Outcomes your company gets the moment your data marts go live.
Analysts define the structure and logic. Business users explore freely – with confidence in every number.
Integrate unlimited data sources – ad platforms, CRMs, databases – with zero connector fees. Forever.
Let analysts focus on real analytics – forecasting, modeling, innovating – not fixing filters and chasing CSVs.
Work from one consistent, governed set of data marts across teams – no more “whose report is right?” or conflicting metrics.
Stats with comment threads attached — like a colleague verifying your numbers in a shared sheet.
Connected BigQuery, set up 37 data marts, built a data model and had live reports in Sheets in under 15 minutes. My team thought I was joking when I showed them how they can now get live reports right in their sheets.
Connect the platforms you actually use to your data warehouse with free, open-source connectors.


We migrated 200+ reports from Looker to OWOX Data Marts. Our team now self-serves without filing a single Jira ticket. Easily the best infrastructure decision we made this year.