
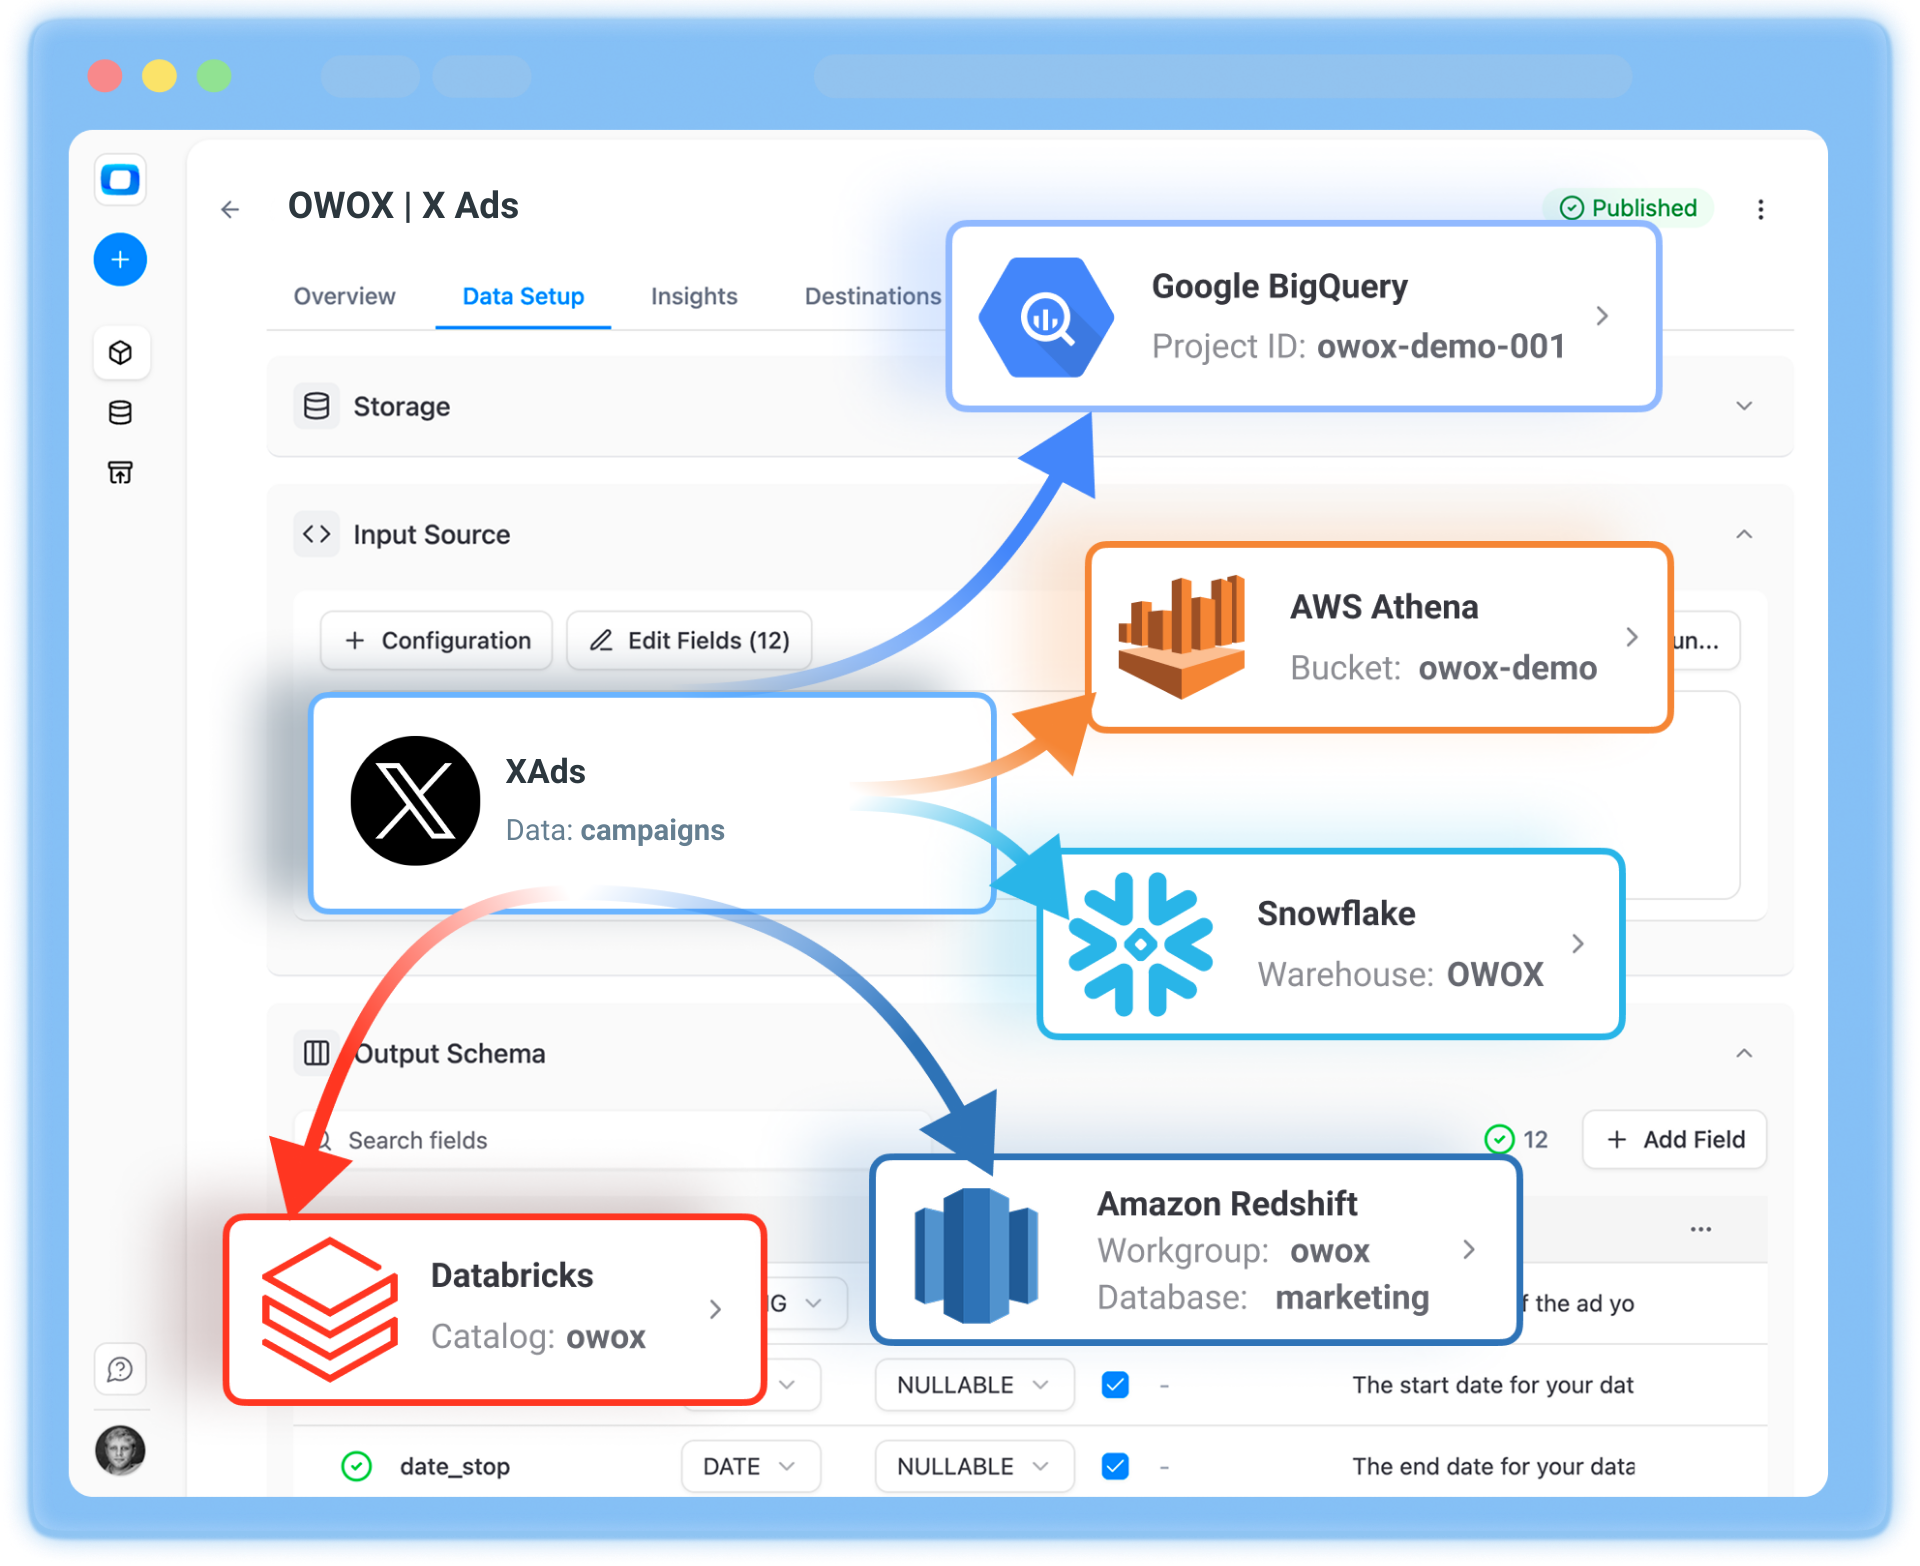
Your Twitter (X) Ads data shouldn't be trapped in a platform you can't query. OWOX collects it into your warehouse on autopilot — no per-connector fees, no vendor lock-in. The entire platform is open-source on GitHub, so you can self-host it today and never worry about losing access to your own data pipelines.
No per-connector pricing — connect as many sources as you need, all included
Fully open-source on GitHub — self-host anytime, no vendor lock-in, your data stays yours
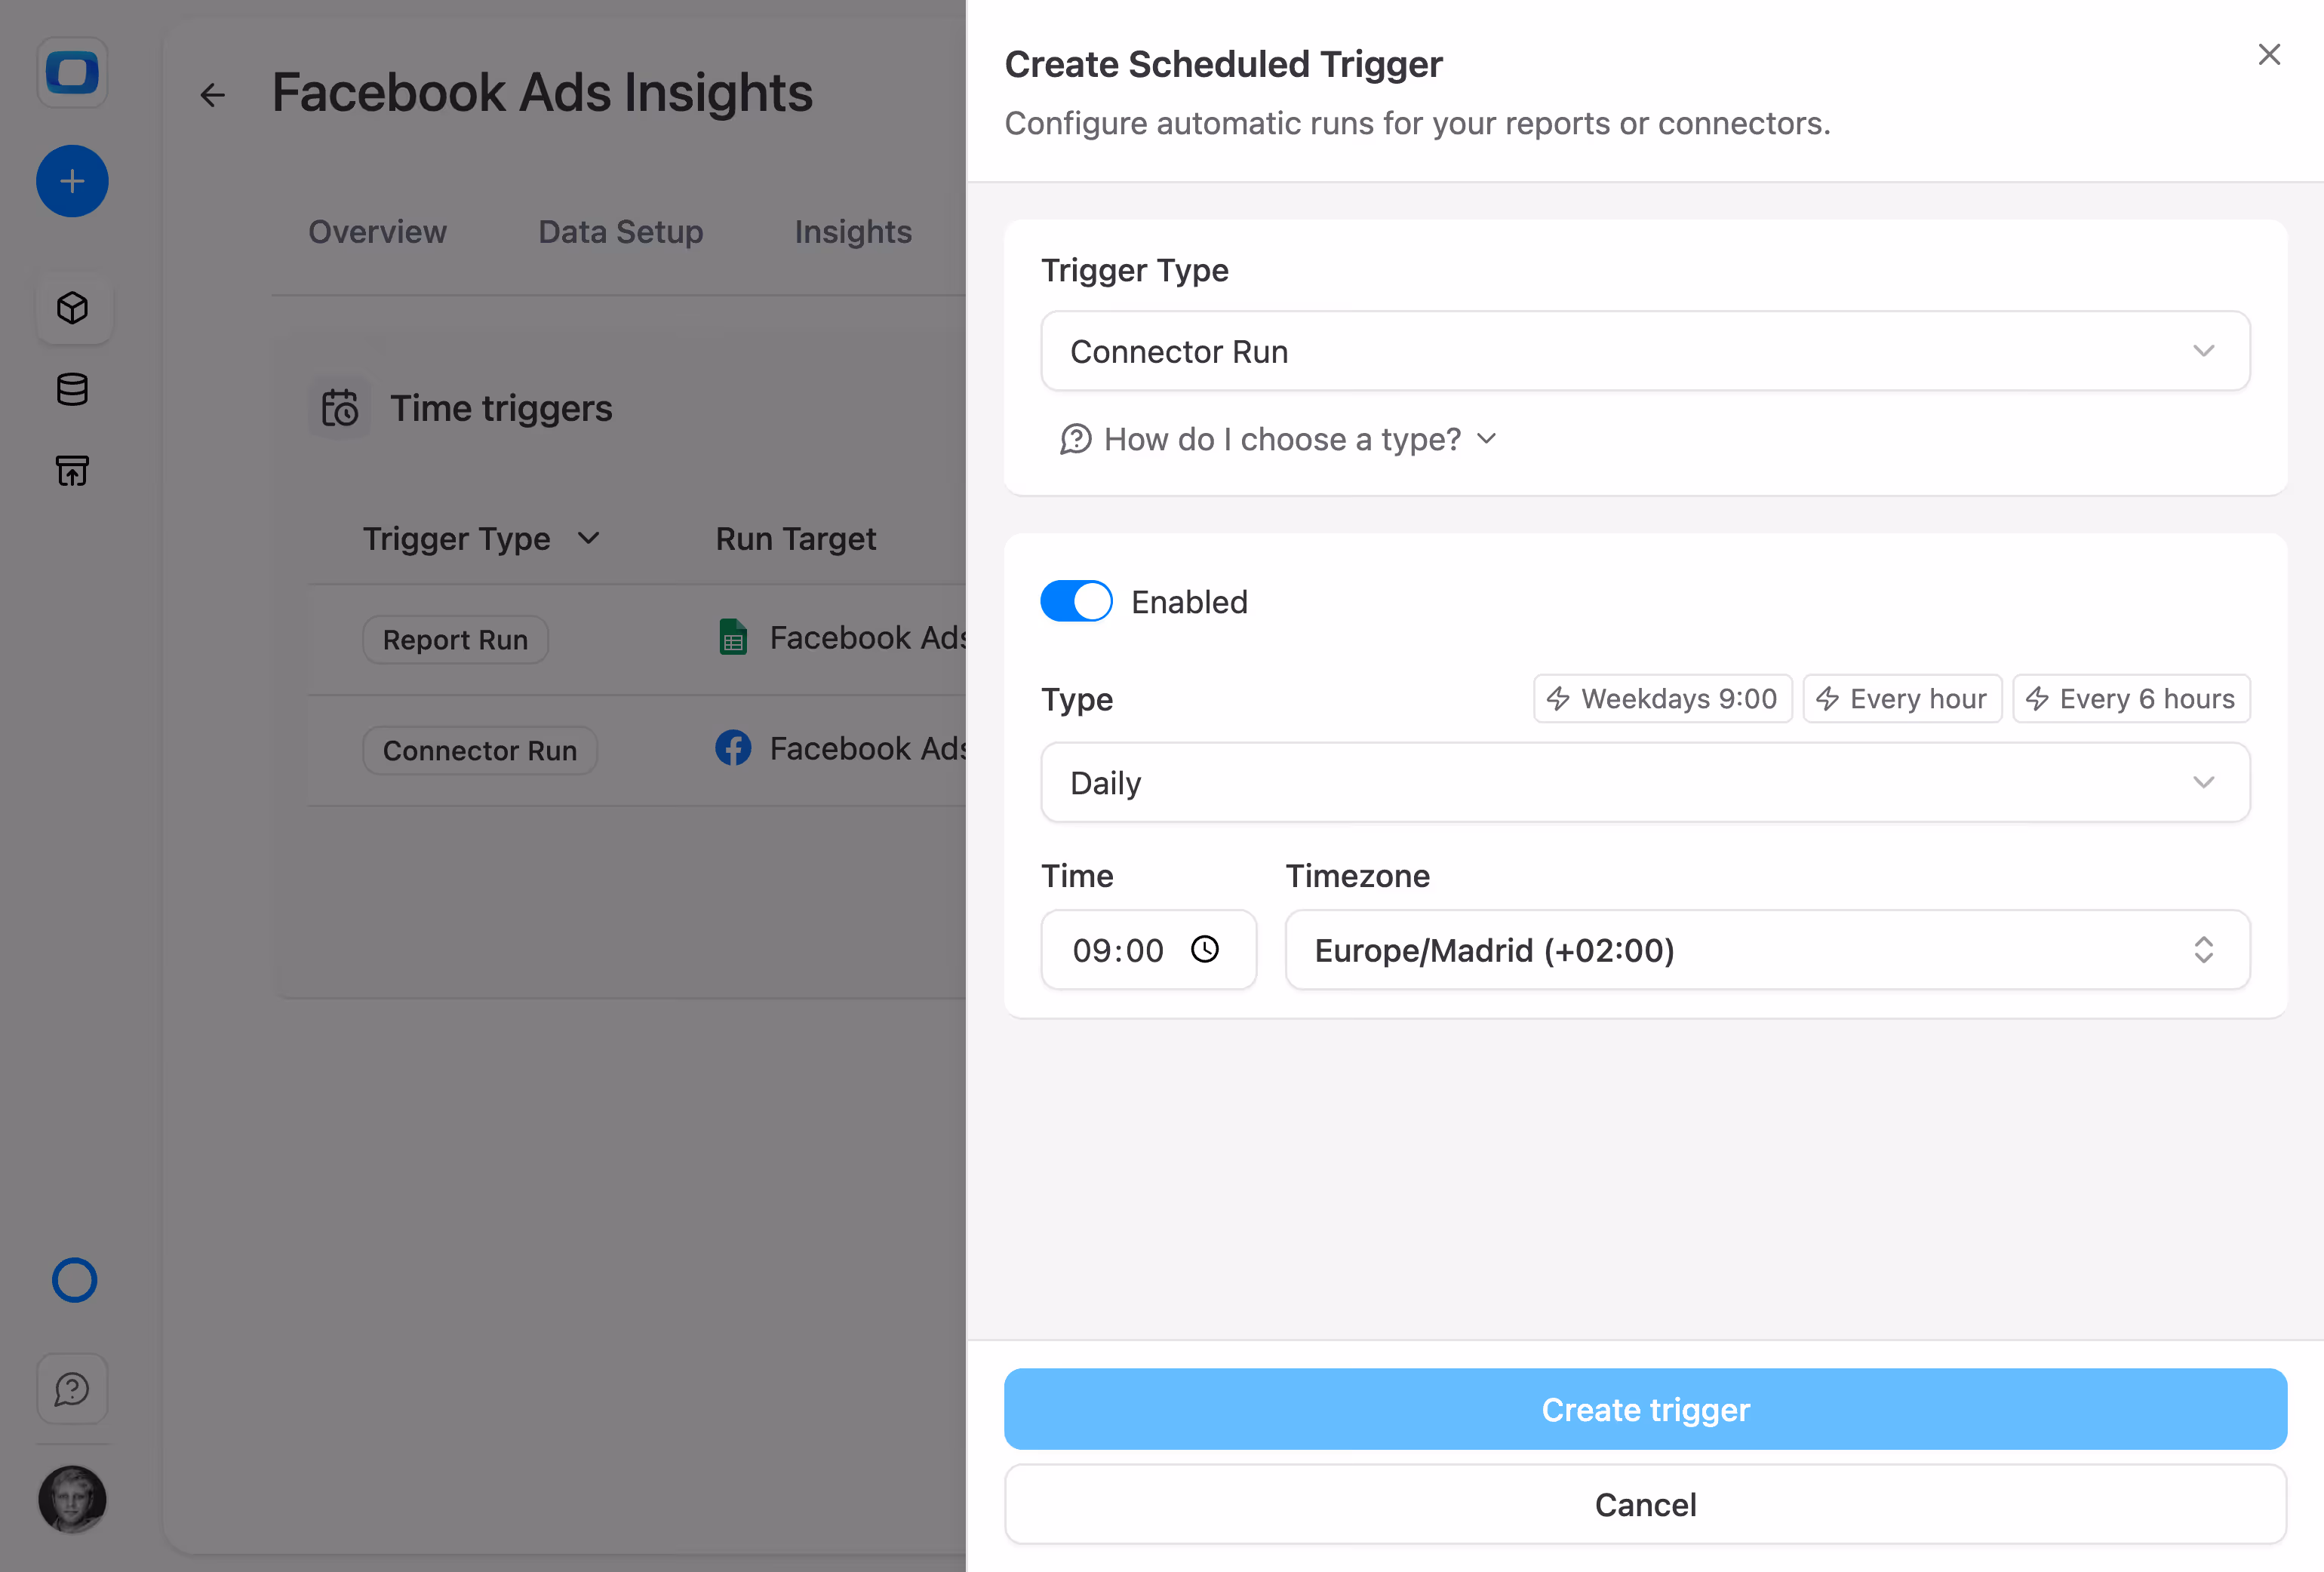
Full transparency and control — every query, every schema, every schedule is visible and auditable
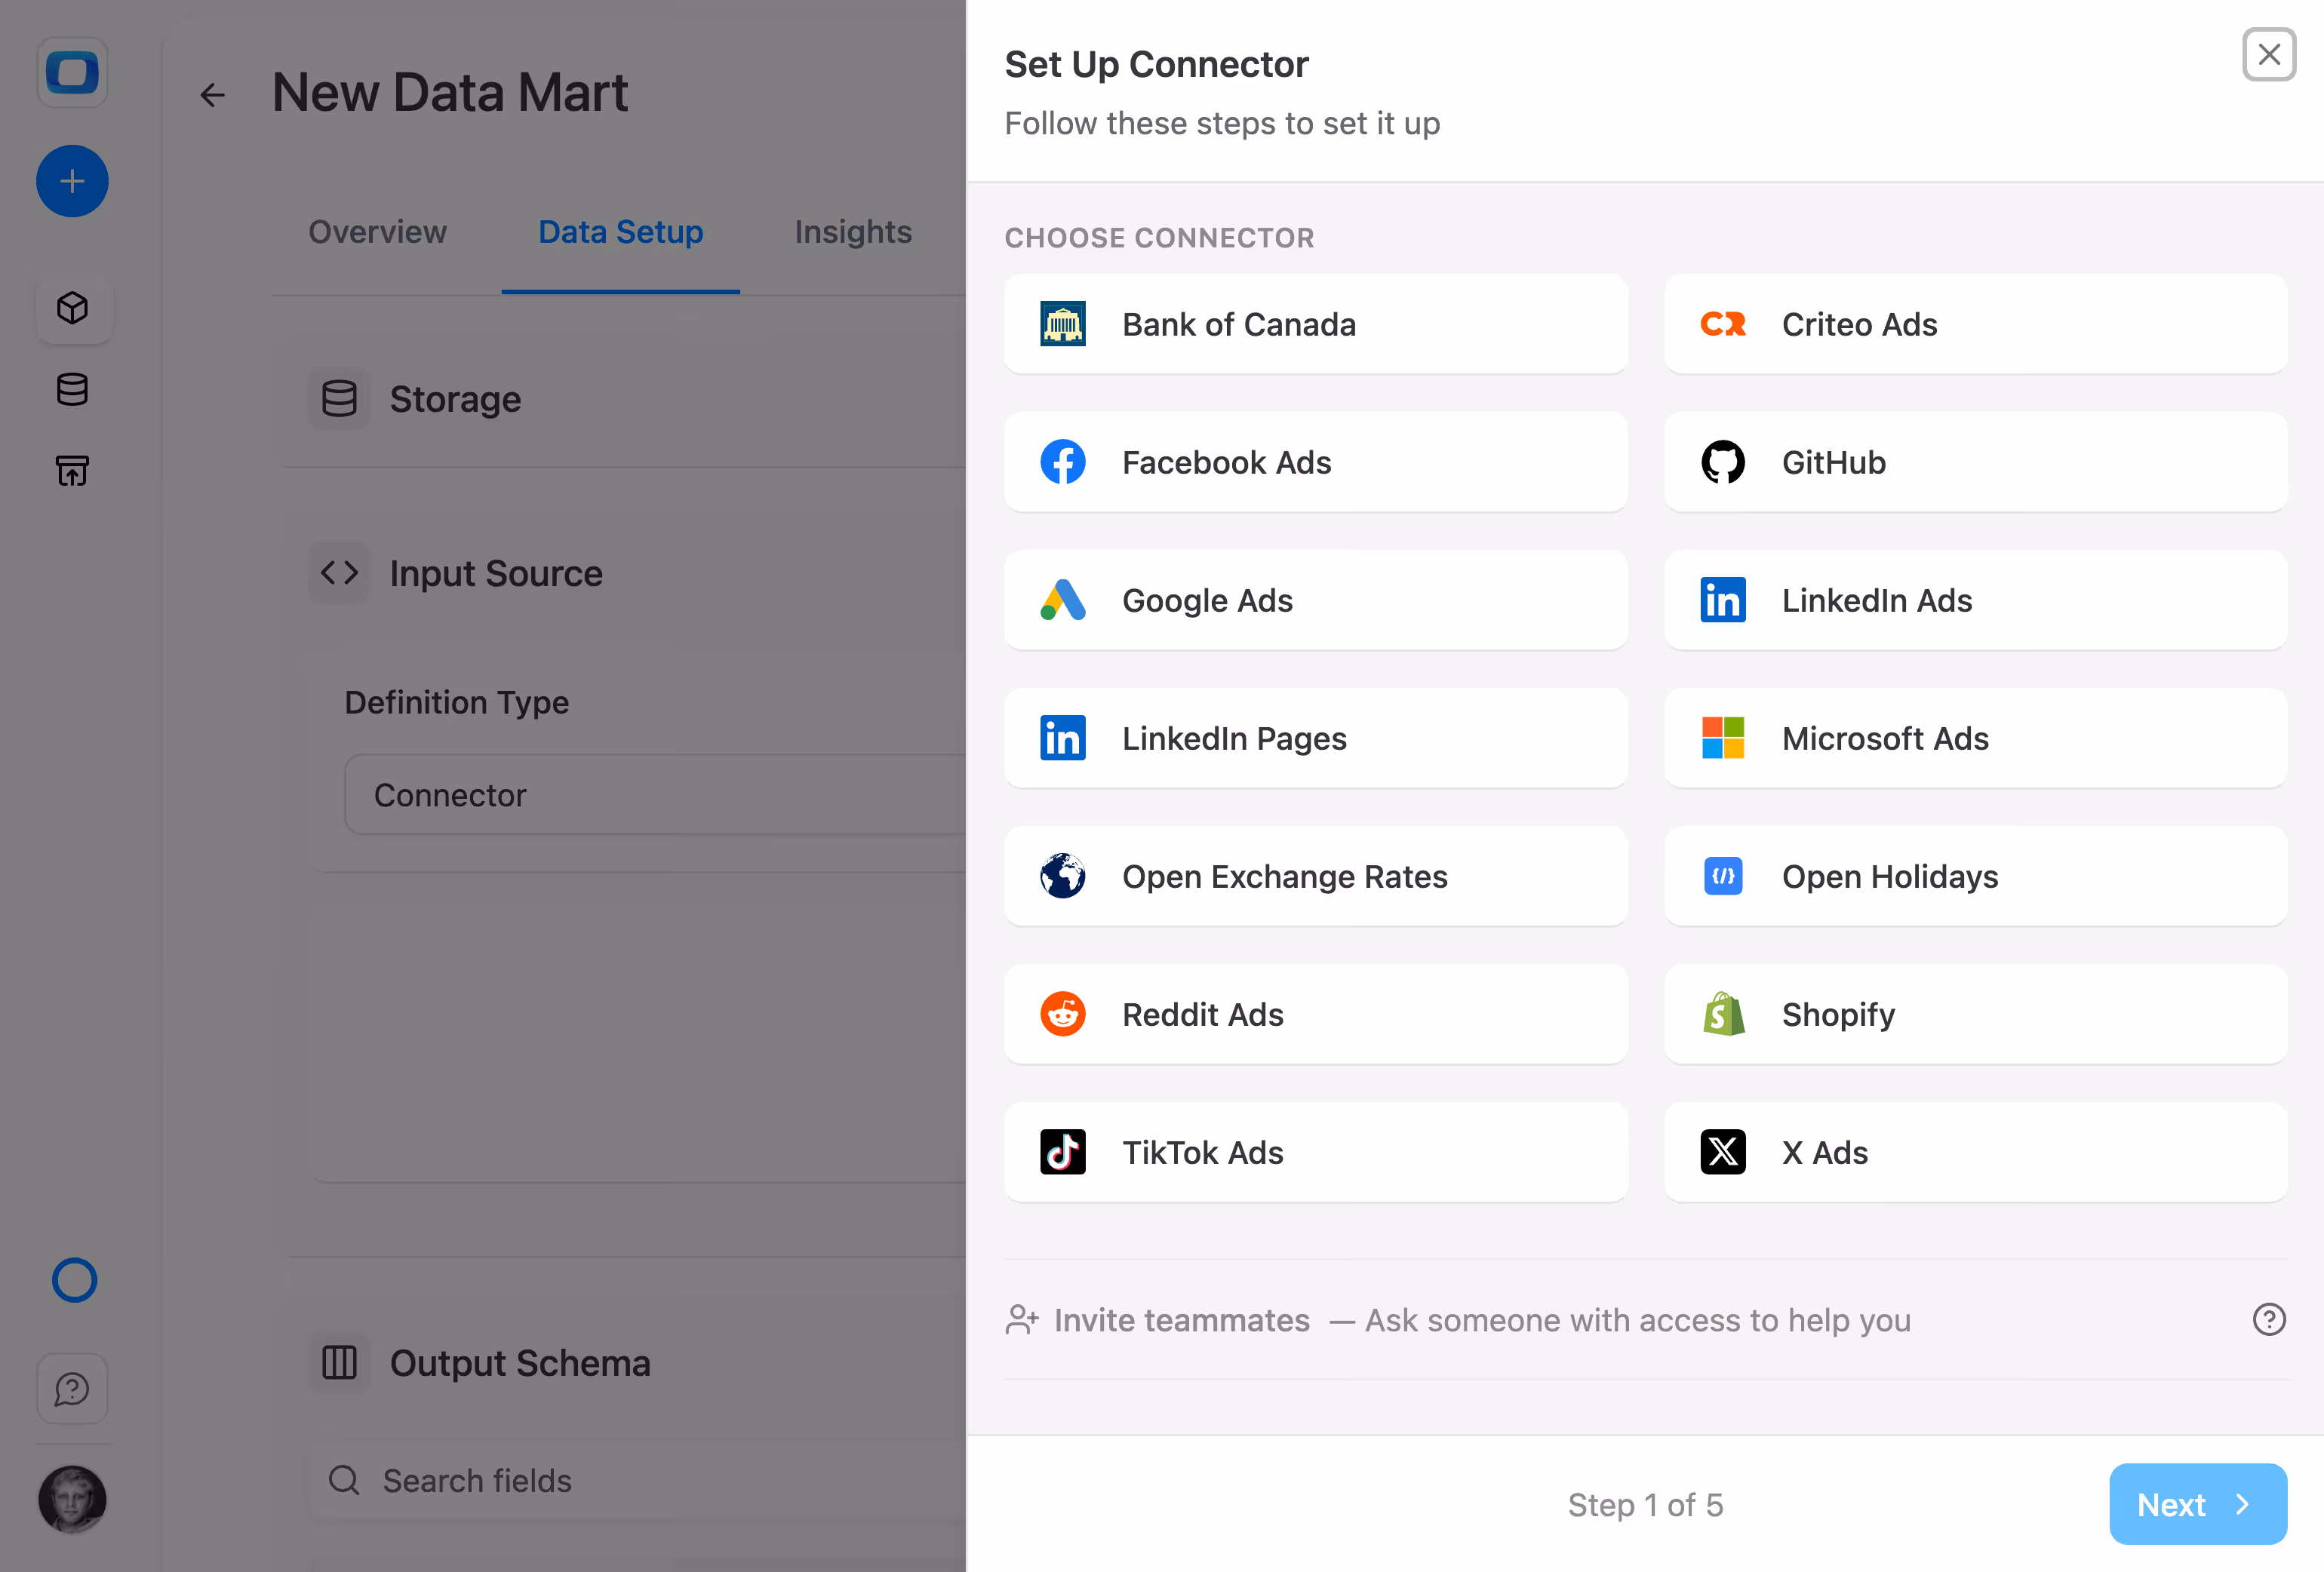
Pull everything your company needs from Twitter (X) Ads without touching code or maintaining custom scripts. OWOX Data Marts handle the heavy lifting.
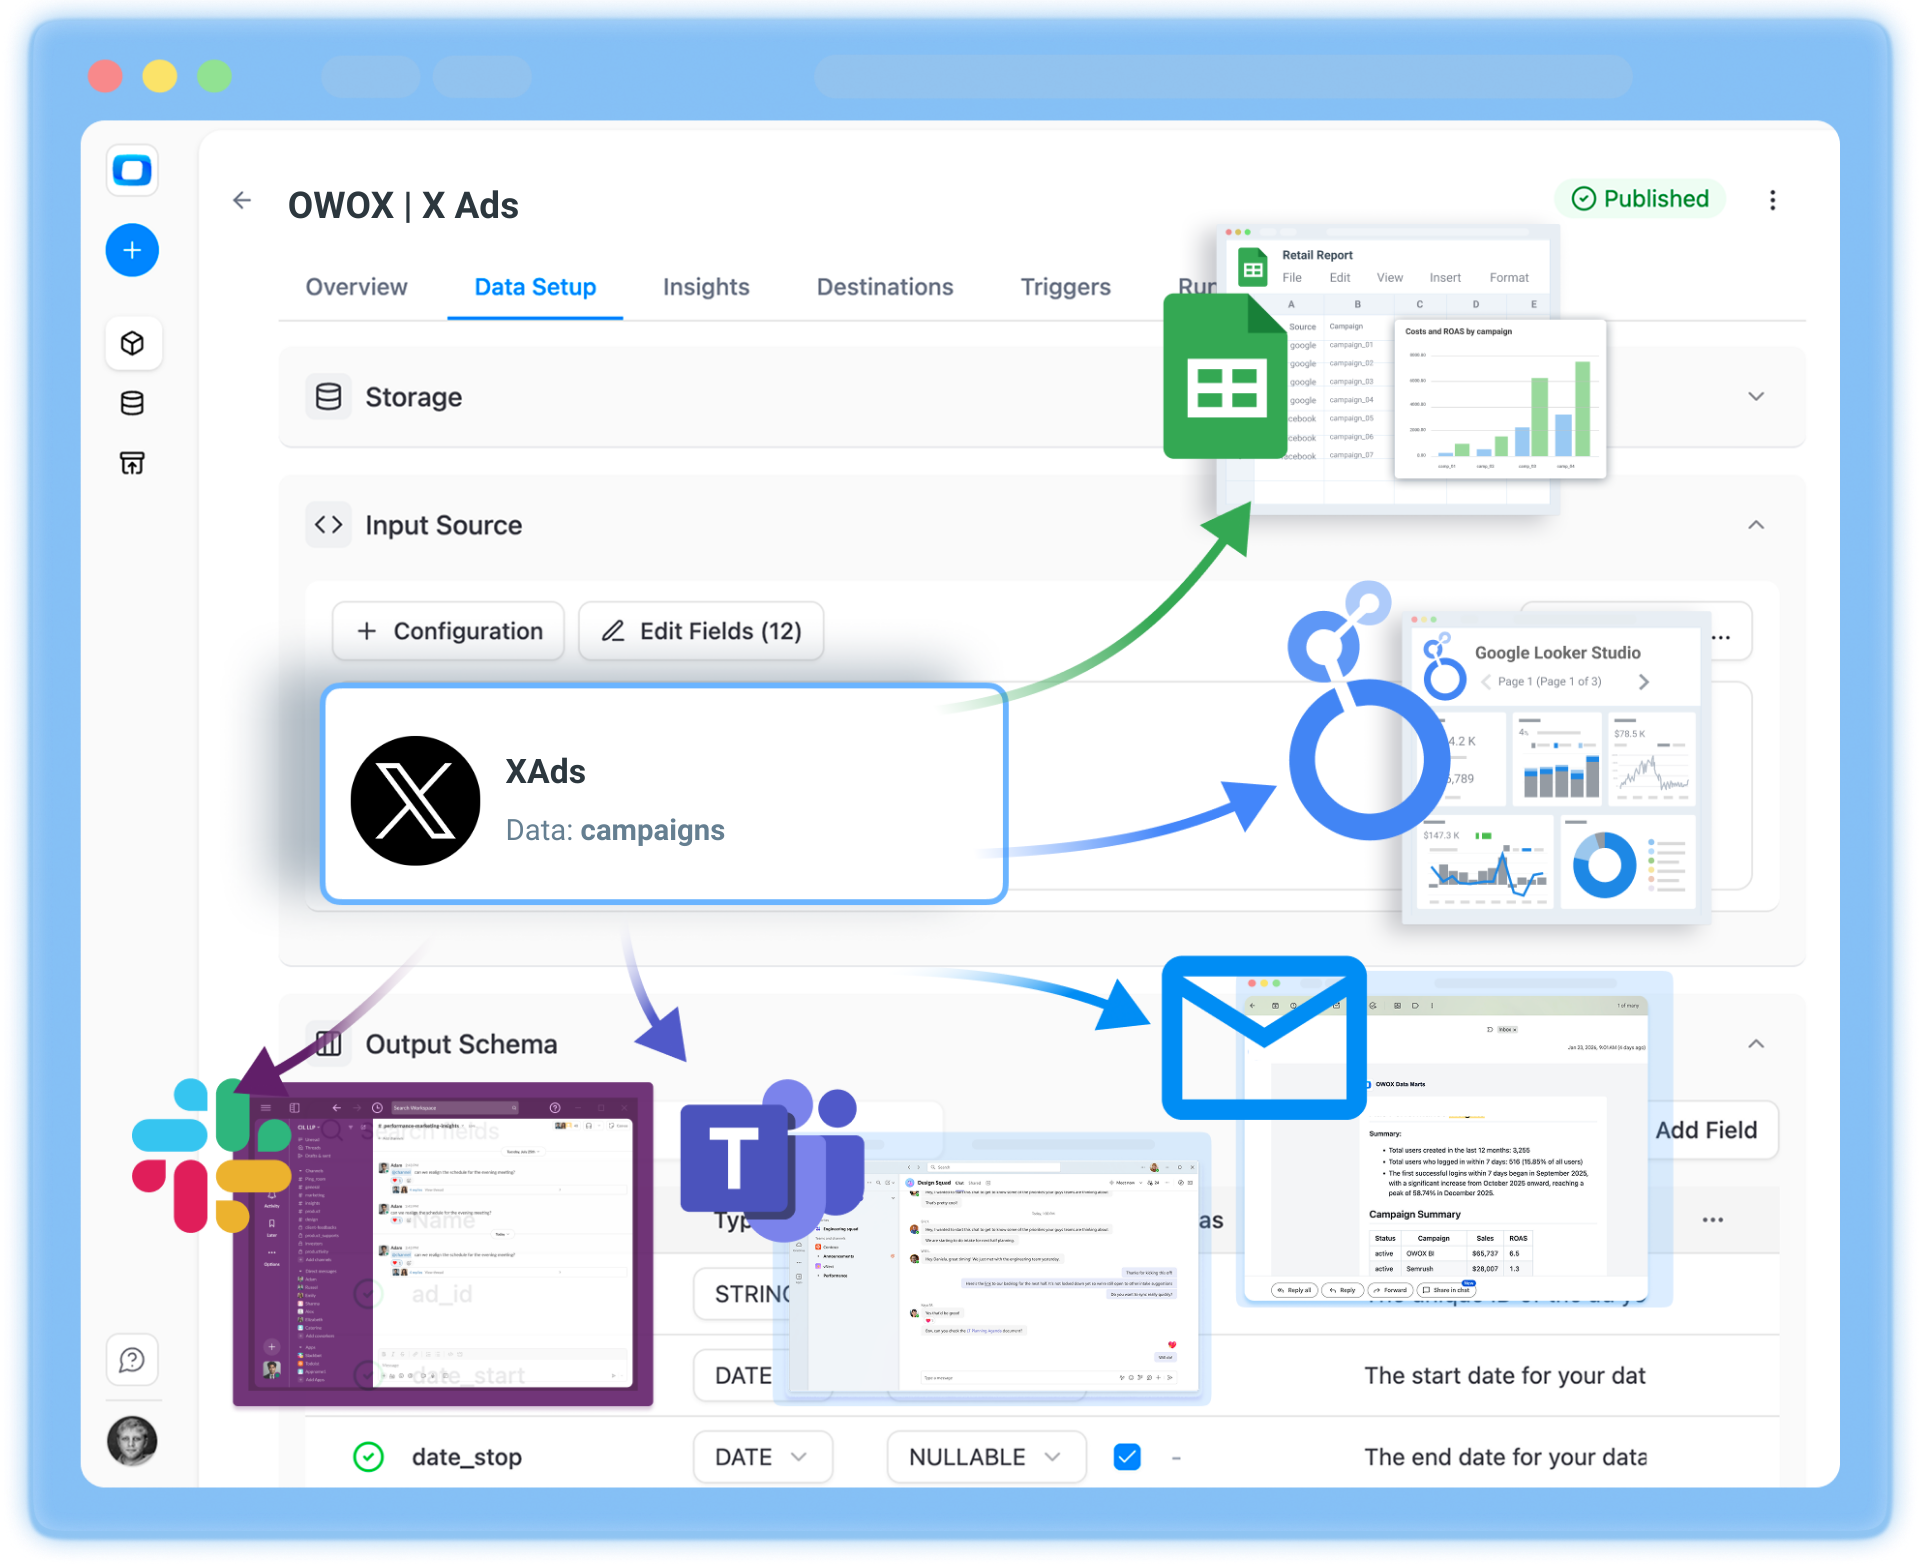
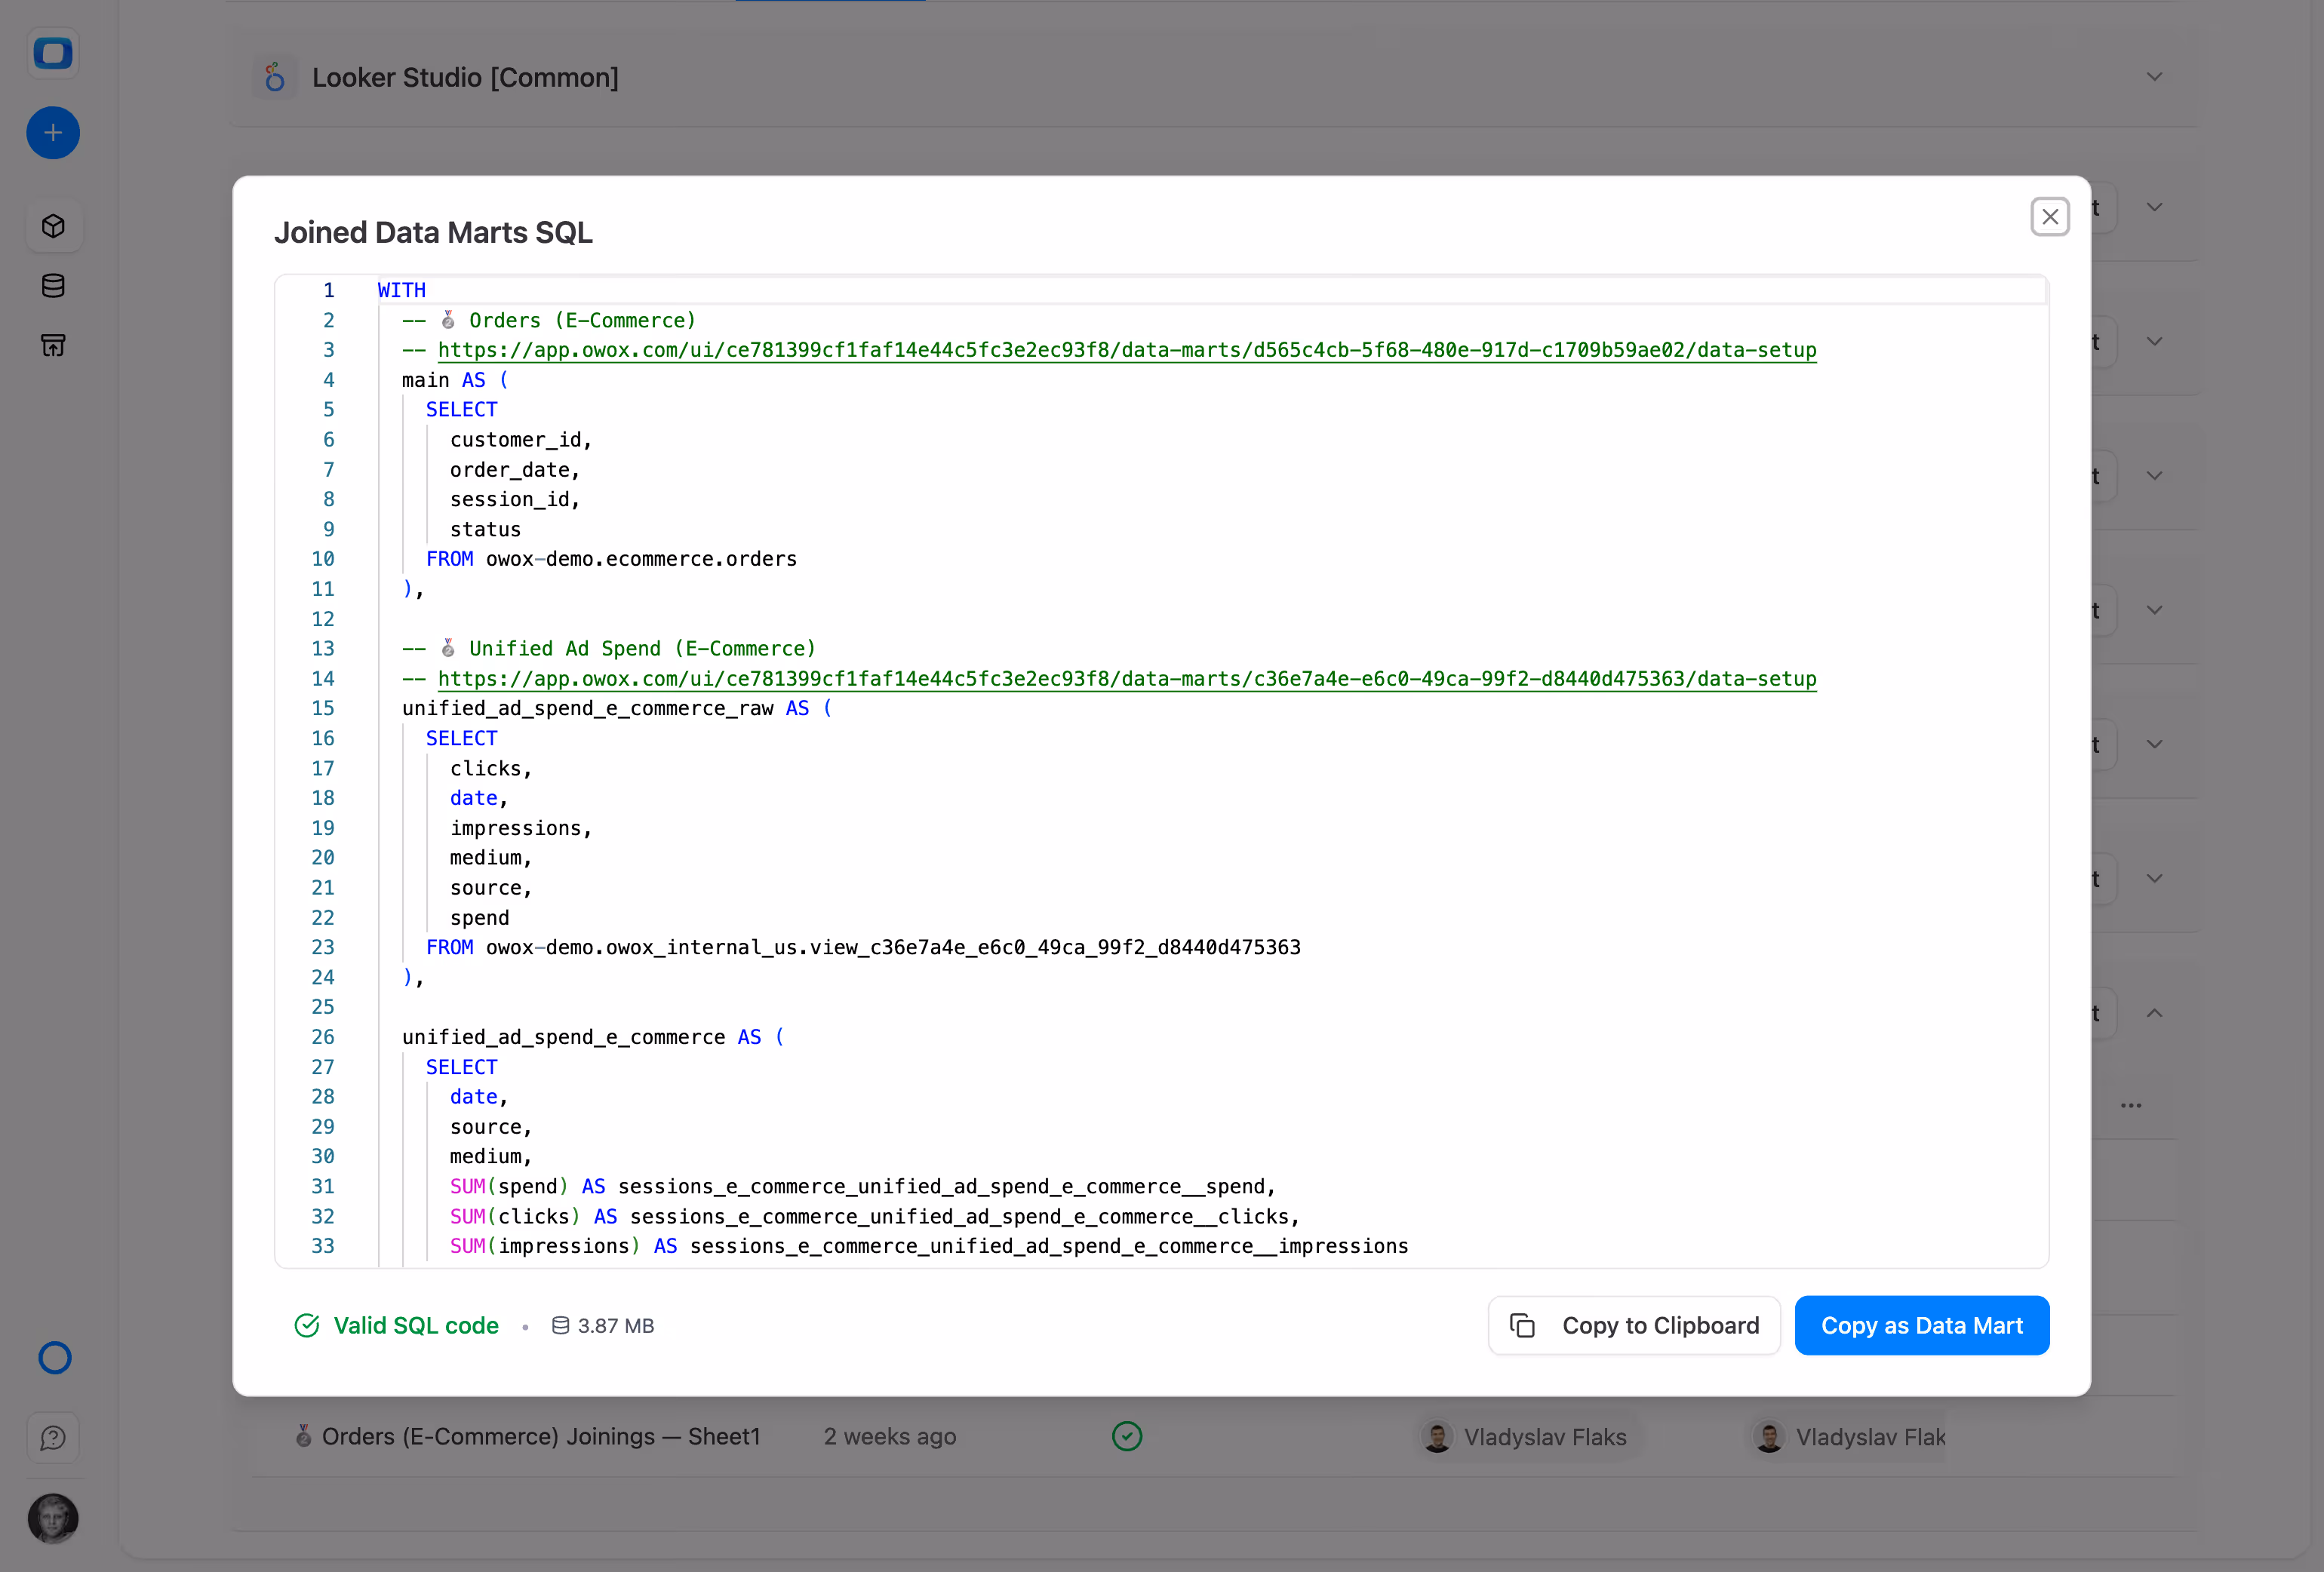
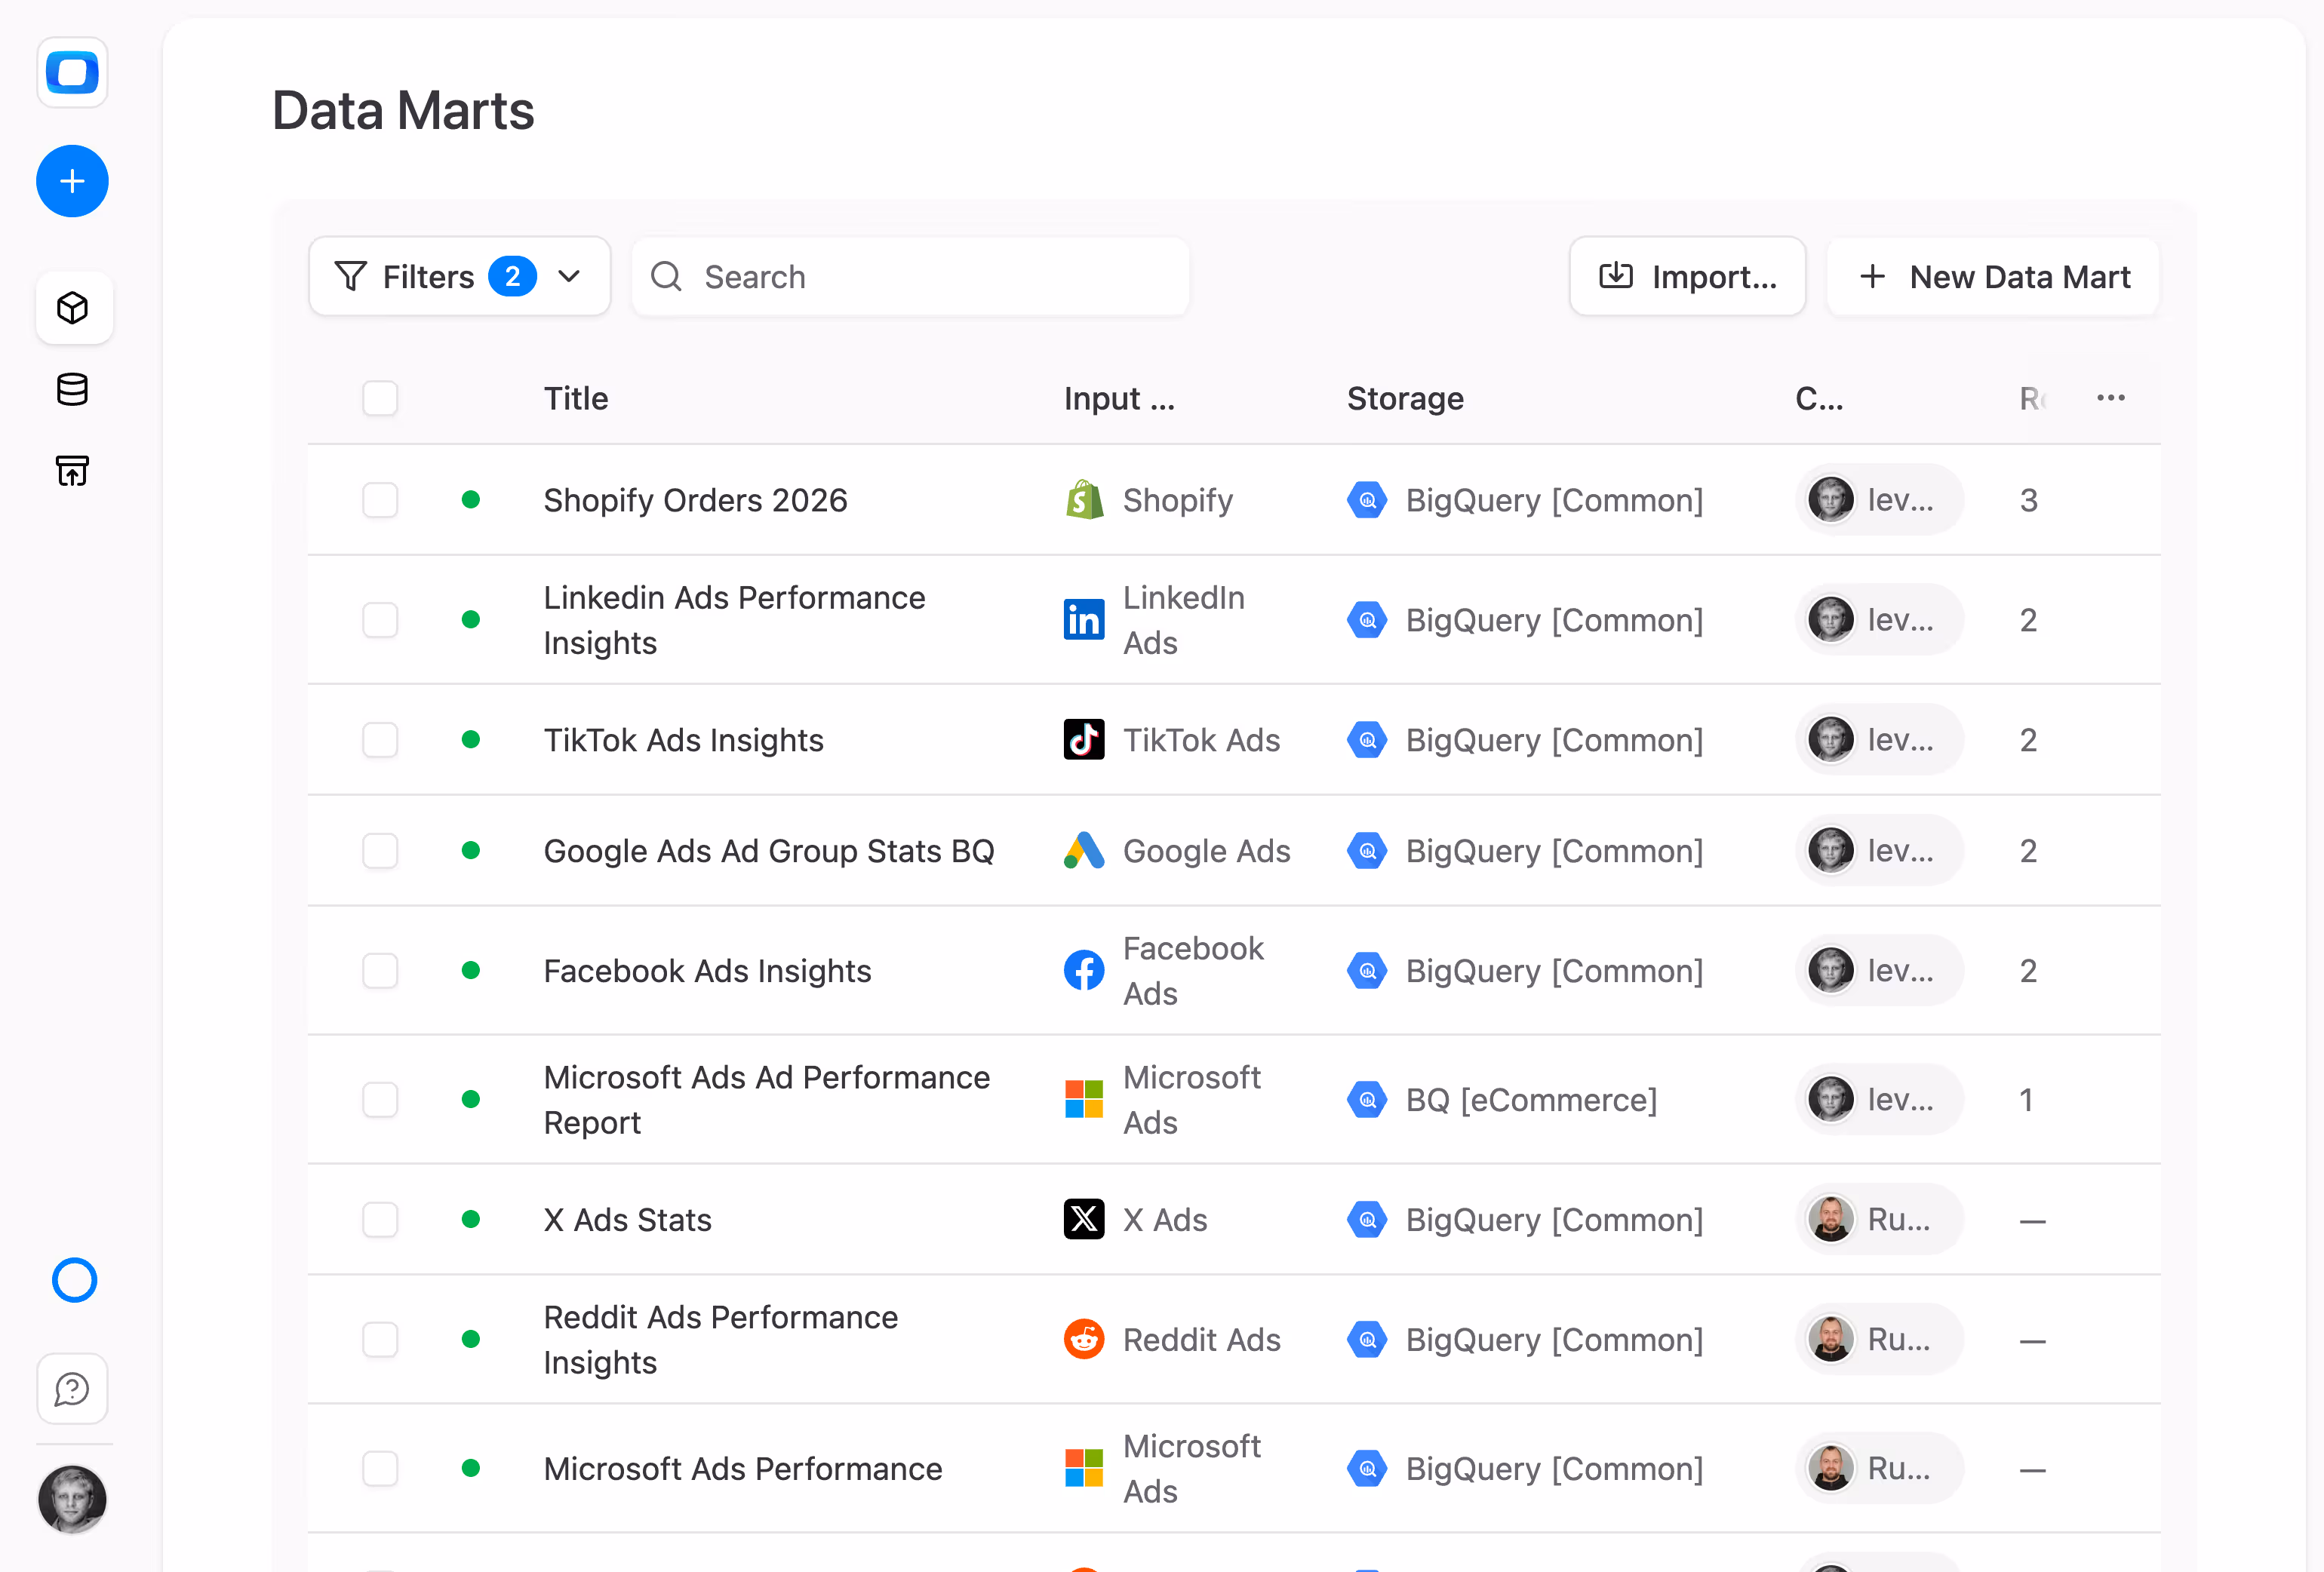
Once your Twitter (X) Ads data lands in your warehouse, OWOX Data Marts make it instantly reusable across spreadsheets and BI tools.
With OWOX Data Marts, your Twitter (X) Ads data becomes instantly available for charts, dashboards, pivots, and spreadsheets.

Eight outcomes you get the moment your data marts go live.
When you connect Twitter Ads with visualization platforms you make more sense of your data. Whether it's pivot table, spreadsheet, chart or graph - you get a comprehensive view & analyze your data faster.
Twitter Ads provides a lot of data, but sometimes you may need to analyze that data in different ways. By connecting Twitter Ads with data visualization tools, you get access to better visualization scenarios that can help you get deeper insights into your business data
When you connect Twitter Ads with visualizations, you can customize your reports and dashboards to answer your specific business questions. Create custom charts, graphs, and tables to represent your data in a way that is easy to understand and act upon
By having a consolidated view of your business data and access to advanced analysis tools, you & your team can make better decisions. Use Twitter Ads data to generate more revenue with faster data decisions.
OWOX Data Marts automates data collection from Twitter Ads and other data sources, reducing manual data entry and ensuring data completeness & accuracy.
OWOX Data Marts offers a comprehensive view of your Twitter Ads data and allows you to merge it with data from other sources to gain deeper insights.
OWOX Data Marts automates data transfer between Twitter Ads and databases or analytic platforms, saving time and reducing errors.
OWOX Data Marts enables you to create blended reports by incorporating data from Twitter Ads into other business reports.
From people who actually use the product. Each quote is attached to a specific claim.
Set up your Twitter (X) Ads connector in minutes. No credit card, no engineering team required.


Finally, a tool that doesn't ask business users to learn a new dashboarding UI. Our marketing team already knows Sheets. OWOX just delivers the right data.
Joinable data marts concept was the thing that sold us. We can now use the semantic layer without building one.
Self-hosted the OSS version on Digital Ocean. Zero vendor lock-in. Contributed a Shopify connector back in week two.