AI dashboard · e-commerce
Net sales review, built by AI on your Data Model
Net sales, profit, channels, customers, products and conversion for an online store. Claude built it through OWOX MCP, and every number comes from a governed Data Mart, not from the AI's guess.
Seven questions, one Data Model
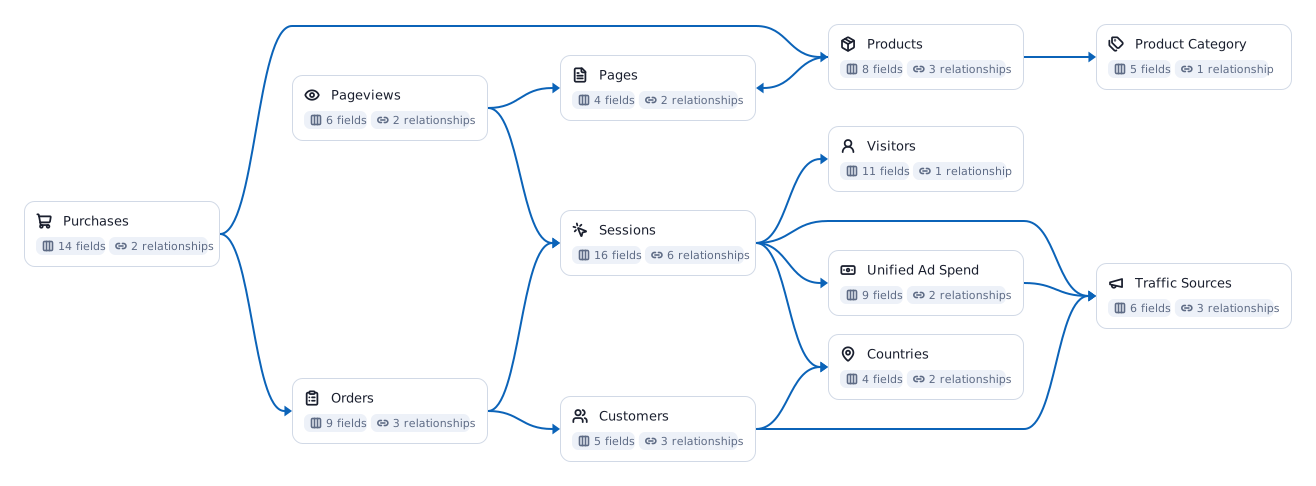
Every view answers one question a sales, marketing or operations lead actually asks. Between them they read nine of the twelve Data Marts in the e-commerce Data Model below, and each view names the ones it uses, so you can open the definition behind any number.
Summary
How is the year going?
Net sales, profit, orders, sessions and conversion against the same dates last year, with each month's net sales next to its gross booked value, so cancelled and returned orders stay visible instead of quietly inflating the total.
Forecast
Where will the year land?
Cumulative net sales day by day against last year, and where the year closes at this pace. The demo store has no plan in its Data Model, so the page compares with last year and says so rather than inventing a target.
Top 5
What moved net sales most?
The five biggest moves across channel, customer segment, category and country. Each cut splits the same revenue, so the moves overlap; the page tells you that instead of letting them look additive.
Acquisition
Do the ad platforms tell the truth?
Net sales by channel, then each platform's spend against the revenue the store itself recorded, next to what the platform claims. Facebook claims 1,091 conversions; the store recorded 720 orders from it.
Unified Ad SpendSessionsTraffic SourcesROASFacebook ROASConversion value
Customers
Who buys, and where?
Net sales by customer segment and by market. Segment and geography are each defined once in the Data Model, so every view cuts revenue the same way.
Products
Which categories earn their keep?
Margin by category against the target margin each one is managed to, and the products that carry the year. Cost of goods sits in the Data Model, so profit is a field, not an estimate.
Conversion
Why did net sales move?
A bridge that splits the change into more sessions, a lower conversion rate and order value, then conversion by traffic type and device.
The metrics on this dashboard
Each one is defined once in the Data Model and read the same way in every view. Follow a chip for what the metric means and how to calculate it.
Net salesNet profitConversion rateAverage order valueSessionsReturn on ad spendFacebook ROASConversion value
An AI dashboard is only as true as what it reads
Most AI dashboards start from an exported file. That works until the second export.
On a CSV
The AI guesses what revenue means, every time
Each export is its own version of the truth, so two dashboards give two numbers. The file goes to whoever has it, and it is out of date the moment it is saved.
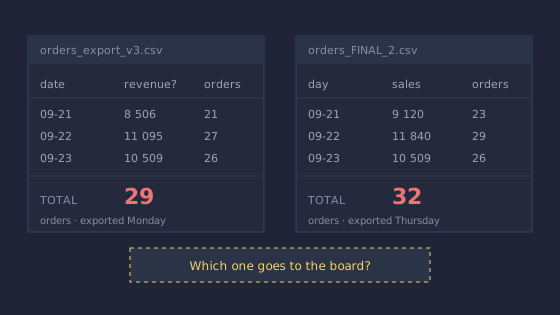
Which one goes to the board?
On your Data Model
Net sales is one field, defined once by your analyst
Every view reads the same Data Marts, so the numbers agree across tabs and tools. Data Marts and Contexts decide who sees what, and the dashboard is a Report, refreshed every time it runs.
One definition, every view.
Connecting the AI straight to the warehouse is not enough either. A warehouse rarely holds the business context, so the AI still guesses what the numbers mean. The Data Model is where that context lives.
From your warehouse to a dashboard in five steps
Your analyst does step two once. After that, anyone with access asks their AI for the dashboard they need.
- 01Your warehouseBigQuerySnowflakeDatabricksRedshiftAthenaYour data stays where it is. OWOX runs on it and keeps no copy.
- 02Data ModelData MartsjoinsmetricsYour analyst defines once what net sales, an order and a channel mean.
- 03OWOX MCP and APIgovernedpermissionsThe only door the AI gets: the Data Marts it may read, nothing raw.
- 04Claude or ChatGPTyour own AIAsk for the dashboard in plain words. It builds it on the Data Model.
- 05AI dashboardReportevery runKept as a Report, refreshed every time it runs, like Sheets or Excel.
Build this on your own data
Connect your warehouse, describe your business once, and let your AI build the dashboards your team asks for.