All resources
What comes to mind when you hear the term “website traffic analytics”?
It’s essentially a process of collecting, analyzing, and interpreting data about your website’s visitors and their activities.
By understanding this traffic data you can make better decisions to attract more visitors, retain them, and ultimately, increase your conversions.
One of the key uses of website analytics is to evaluate and improve your digital marketing strategies.
By analyzing which strategies are successful in attracting visitors and driving engagement, you can optimize your online campaigns.
Website traffic analysis isn’t just about how many people visit your website. There are several crucial aspects you need to understand:
This article will give you all the knowledge you need about web traffic and tools to analyze it, using Google Analytics 4 and OWOX BI as examples.
To measure a website's performance, analysts and marketers look at website traffic: the total number of visitors along with information on where they came from and how they got to the site.
Understanding website traffic analytics becomes much easier when you comprehend the key terms involved. Let’s delve deeper into each one, so you have a solid foundation to build upon. Keyword research is crucial in analyzing website traffic and gaining insights into competitor strategies.
Each of these terms plays its own role in website traffic statistics analysis.
Having a proper analytics setup will not only improve your understanding of website traffic analytics but also help you analyze and optimize your website more effectively.
Your toolbox for traffic checker will contain several tools to visualize and explore your site metrics. These services are programmed to examine your website from the inside out and give you a report based on this examination.
One essential tool is Google Search Console, a free tool that provides insights into website performance in search engine results.
The most popular (and free) tool for website analysis is Google Analytics 4. Google Analytics 4 shows data about website statistics and data on user behavior in the form of events and sessions. Actions on the website are registered as events, and then those events are merged into sessions according to Google Analytics 4 logic.
A traffic checker is another essential tool for analyzing and monitoring website traffic, keyword rankings, and competitors' data.
What you should know about your web traffic are its source channels and metrics. This would help you answer the most important questions as a website manager or owner:
This information empowers you to identify what’s working well on your website and what’s not, where improvements could be made, which marketing strategies are driving traffic, and, most importantly, how you could increase your conversion rates to drive business growth.
You can find answers to these questions by looking at sources and channels in reports and dashboards.
Google Analytics is really very powerful for analyzing websites, but it has its limitations which are not so comfortable for marketers and business owners:
Luckily, there are special tools for end-to-end analytics for businesses that dream big.
As a website is part of the overall marketing and business strategy, it’s essential to analyze it in the overall context: connected with advertising channels, affiliate expenses, your CRM or CMS systems, email marketing tools, and other data flows.
A comprehensive website statistics report is crucial for effectively presenting website data. It should include comparative metrics to provide stakeholders with actionable information.
To establish end-to-end analytics, start by collecting all of your marketing and sales data in one place, creating a single source of truth for data across your organization, and merging the data flows.
We would like to introduce you to OWOX BI — an all-in-one marketing analytics platform designed specifically to avoid the limitations of Google Analytics 4 and to be a powerful personal analytics assistant for marketers.
OWOX BI helps you collect, normalize, and merge data from different sources and prepare for reporting:
OWOX BI collects all of this data automatically without data sampling so you can create a complete database for all kinds of reports: LTV, ROPO, historical analysis, predictive models, machine learning funnel-based attribution, and forecasted marketing performance.
Have you ever dreamed about a tool that would give you this granularity and predictive opportunities in just a few clicks?
Analytics systems collect, process, and report on user interactions with websites, capturing event data like clicks and scrolls. They group these events into sessions for meaningful analysis and provide customizable reports, helping businesses understand and optimize web performance by offering insights into user behavior and website effectiveness.
Tracking traffic data is crucial for analyzing website performance, visitor engagement, and competitor analysis, providing valuable insights into traffic sources and user interactions.
Most of the web traffic analytics systems collect information about actions on the website, registering clicks, scrolling, form submissions, etc. All of these events are gathered by the analytics system and marked with a timestamp and other event parameters from the data-trace of each website visitor. This is the event data (in GA Universal it was called hit data), which is essential for web analytics.
Tracking and analyzing your own website traffic is crucial for evaluating the effectiveness of SEO and marketing strategies.
In order to track event data, you need to add a tracking code of the analytics system to your website pages - typically called Pixel.
Without grouping all these website interactions into sessions, it’s impossible to use them for web performance analysis effectively.
Keep in mind that every analytics system has its own unique logic for creating sessions from events. Imagine having a list of all website activities but lacking the details, like who executed those actions, how long they were taking place, or how regularly. Without this information, you would be blind when it comes to analyzing website activities and performance.
Analyzing traffic statistics is crucial for gaining insights into website performance, keyword rankings, and competitor strategies. This brings us back to sessions - they are fundamental for analyzing web traffic. The total number of sessions is a metric that provides some immediate insights. In fact, it’s often the first pre-processed data that you’ll spot in your reports.
Website analytics reporting is a way for an analytics system to inform you about what's happening on your website.
Tracking website traffic statistics is crucial for gaining insights into user behavior and traffic sources. Tools like Google Analytics can help monitor and analyze these statistics, guide marketing strategies, and improve content targeting.
You can use prebuilt reports (such as a social media traffic report) or build your reports by combining metrics, parameters, and dimensions. For a more advanced approach tailored to professional needs, explore SEO tools for agencies that offer deeper analytics and customizable reporting features.
However, the most insightful reports are built with raw unsampled data (Google Analytics 4 applies data sampling when the volume of data exceeds its limits). The completeness of input data defines the quality of the report and the decisions you make based on this report.
Understanding key entities like sources, channels, and keywords is crucial for accurate reporting in web traffic analytics.
In web traffic analytics, understanding key entities like sources, channels, and keywords is crucial for accurate reporting. These entities help track where visitors come from, how they navigate to your site, and what they search for, enabling businesses to analyze user behavior and optimize their online presence effectively.
Analyzing traffic sources is essential for understanding the origins of website visitors and their impact on website performance.
The source defines the site or the platform from which a user clicks a link to enter your website (in JavaScript, this is the «document.referrer» string). If the source page is another page on your site, it’s the previous page.
The source of your traffic may be presented as a link to the web address from which each particular visitor came.
Your sources might be:
The point is that people can visit your website from different types of links and through different channels.
Traffic from organic search is primarily generated through search engines like Google, making it crucial to enhance this traffic source.
When the source is undefined, typically, the traffic is marked as Direct.
This happens for one of 2 main reasons:
The channel refers to how a visitor navigates to your site. For example, these are some of the channels in Google Analytics 4:
Evaluating and improving website performance through data analysis is crucial for capturing higher organic search traffic. Effective SEO measures and tools that offer detailed reports on a website's organic search performance compared to its competitors can provide valuable insights.
You can read more about UTM tagging and use it in your own web traffic analysis. It’s handy to create custom segments based on channels and analyze targeted traffic apart from all other traffic.
For example, here is how Google Analytics 4 lays out each channel and the mediums (the general categories) to which it belongs. The medium description is essential to identify channels and define their type.

A keyword generally refers to a word or phrase that users enter into a search engine. Keywords are closely linked to how a search engine interprets a user's intent and how it ranks and displays links, websites, and resources in the search results.
Search engine optimization (SEO) plays a critical role in driving traffic to websites by focusing on optimizing for search engines like Google, which accounts for a vast majority of global online traffic.
To understand which keywords drive valuable traffic and conversions, you need to analyze them and determine what your customers are actually searching for when they seek out your website, services, or products. Creating content that closely aligns with your customers' intentions will yield the best results.
Analytics tools identify the keywords that users enter into the search bar as "keyword referral data." As you may already know, there are two types of keyword referral data:
Data about organic keywords is hidden due to Google’s policies, while data on paid keywords is visible and available for your analysis. That’s the reason, some reports will show a «not provided» value. You can also get «not provided» values from a paid channel if your campaigns are not correctly set.
Here is how OWOX BI helped to discover 2.4 times more keywords, assisting in conversions and increasing PPC advertising ROI by 17%
Now that are familiar with sources, mediums, channels, and keywords, we can proceed to channel grouping - the way to analyze your traffic by your rules.
A channel grouping is a level of classifying web traffic. The default channel grouping in Google Analytics 4 matches the lineup of channels described below.
Analyzing competitor website traffic can provide valuable insights by comparing traffic metrics between your site and those of rival websites. This helps in understanding market trends and improving your own traffic generation strategies.
It’s handy to use this grouping in a general way, but as you know, these groups are aggregated, so they can hide some insights that might be useful for you.
For example, if you want to analyze traffic from your outreach campaign, you should create a custom channel group based on a referral channel, separating traffic with the help of UTM tags.
Analyzing website traffic involves examining the data collected from visitors’ interactions on your site to gain insights into user behavior, preferences, and trends. This process helps identify the sources of traffic, user engagement levels, and the effectiveness of marketing strategies. By understanding these metrics, businesses can optimize their website’s performance, improve user experience, and drive conversions.
To understand how much traffic a competitor's site receives, various tools like Google Analytics and Ahrefs can be used to analyze and track website traffic.
Dimensions are attributes of your data. Adding dimensions is the most popular and simplest approach to analysis.
This report shows how many sessions originated from each country. It's a simple breakdown by location and helps you understand which cities drive the most traffic to your website.

Understanding website statistics is crucial for gaining insights into website traffic and current trends, which can help you stay competitive in the online landscape.
And here’s what we can get by adding one more dimension:

You can add a dimension like Browser to see how the number of pages viewed per session changes based on the user’s browser. This insight helps identify if certain browsers, like Chrome or Safari, result in higher or lower engagement, which could reveal issues with user experience or performance on different platforms.
By adding this additional dimension, we can see something that was previously hidden: the fact that the browser influences the pages/session metric quite a lot, even for people in the same city.
By choosing the right dimension-metric combination, you can find a lot of useful insights for your website development. Wouldn’t it be great if someone could recall all the dimension-metric combinations for you? OWOX BI Smart Data knows popular dimension-metric combinations to build any kind of report in a couple of clicks without hours of thinking over the report structure.
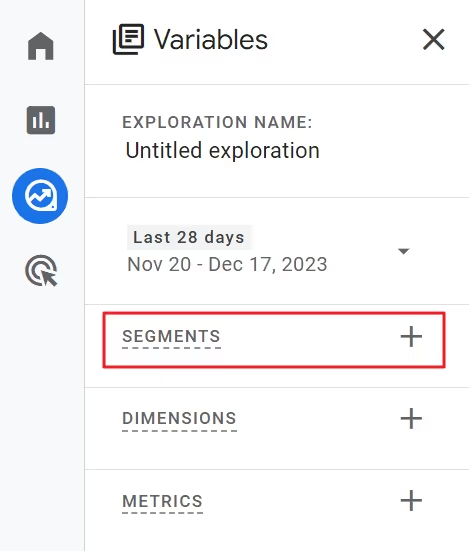
Segments offer a great possibility for analysts to compare part of the traffic with the whole picture. Comparing segments to other segments or to total data, you can conduct a simple analysis that might be useful for beginners.
It's also crucial to use multiple tools for analyzing web traffic stats, as different tools offer unique features that provide a more comprehensive understanding of website traffic estimates.
Here are some important tips on segments in GA:
Segments are important based on the understanding that aggregate data can’t help you a lot («All data in aggregate is crap,» according to Avinash Kaushik, who knows what he’s talking about). But if you slice and dice your data the right way, you’ll see many interesting insights.
In Google Analytics, you can create a segment in any kind of report.
Here are some examples of segments for you to try out:

The other way to use segments is to create them for better performance of remarketing, trigger emails, and special offer campaigns.
Okay, we’ve gotten through the segmentation part. That’s great! But to prepare you fully, let’s see what web traffic metrics you have to know to analyze everything correctly.
As Peter Drucker once said, «You can’t manage what you don’t measure.» But measuring on its own is a dead end. Explaining and interpreting — that’s how you get profit from measuring. So be careful with metrics; don’t forget about the real people standing behind them.
Monitoring and analyzing traffic stats is crucial for understanding website performance, including sources of visitors and engagement metrics.
Here’s a list of essential metrics for an e-commerce website (and the corresponding reports in GA):
User → User Attributes → Demographic details

If you want to find out where your customers come from to optimize your ads campaigns, develop the website, and email marketing, you need this report. These primary dimensions are available in the Demographic details report: Country, Region, City, Language, Age, Gender, and Interests. The report shows a map of the world by default, and color saturation demonstrates the proportion of sessions from different regions.
Audience → Overview
This group of metrics shows your visitors’ behavior on the website: whether they’re active and interested — Average Session Duration metric, how long they stay on the site — Page / Sessions metric, how fast they leave the site — Bounce Rate, etc.
Also, in the device and platform dimensions, you can find insights about how page loading speed and website presentation on different devices influence your visitors’ behavior. Sometimes, waiting for the page to load is painful, and people leave the website; the bounce rate starts growing, and you can notice this to make improvements.
Behavior → Site Content → Landing Pages, Behavior → Site Content → Exit Pages
This is another dimension to investigate. Looking at all behavioral metrics at the level of pages will help you understand the most popular and least popular pages and give a hint about what to do to improve the situation. For example, if one of your checkout pages is among the popular exit pages, it might be a sign of technical problems.
Behavior → Site Search
You may track a lot of events on your website, from a simple click anywhere on the page to conversion events: purchases, email subscriptions, comments and feedback, etc. Why do you have to track all of these events? If you want to grow, you should look at the keywords your customers are entering in the search bar and identify the most popular and least popular buttons.
Conversions → Multi-Channel Funnel → Overview
If you imagine a way to get from anywhere on the internet to make a purchase on your site, you can see that’s a long path. Or a funnel, as marketers call it. Website traffic analytics tools help you understand the sequence of channels that lead a visitor to make a conversion and show the importance of each channel.
If you see that your typical user journey, a sequence of channels that it takes to convert your visitor into a customer, has more than three channels, you need a perfect attribution model that would evaluate the whole hero’s journey and the contribution of each channel at each funnel stage. The standard attribution model won’t fit your needs, as one of the channels will be overvalued while the value of other channels will be underestimated.
Find out how to solve this attribution problem with OWOX BI. As you see, metrics and investigations are waiting for you. You can explore more marketing metrics in this article. Remember one more thing while working with metrics and statistics: they’re always dynamic, and the change in values matters more than today’s or yesterday’s values on their own.
Also, don’t forget that statistics about website traffic are not the end of your website analysis. Let’s take it one more step ahead.
On your way to end-to-end analytics, you’ll get to the stage of merging the sales data, also known as internal / CMS / CRM data with the user behavior data and, basically, your cost data.
At this stage, you’ll enrich your on-site analytics data with information about sales performance and completed orders. A simple way to do that is using OWOX BI. Additionally, tracking traffic for your own website using tools like Google Analytics and MonsterInsights can provide valuable insights into your website's performance and the effectiveness of your SEO and marketing strategies.
With sales and CRM data, you can evaluate the real value of your marketing efforts and estimate the performance of the entire sales funnel without missing important insights.
You can get answers to these questions with OWOX BI:
Get your questions answered faster. Build an end-to-end analytics system with OWOX BI, make wise decisions about your website performance and cross-channel budget allocation, and move from chaos to clarity.
Google Looker Studio templates are pre-designed layouts that help streamline the process of creating data visualizations and reports. These templates provide a foundation for displaying data in a visually appealing and easily interpretable way, allowing users to quickly generate insights from their data.
A website traffic checker is an essential tool for analyzing and monitoring website traffic, keyword rankings, and competitors' data, providing detailed reports on traffic sources and user engagement metrics.
With various customizable options, these templates can be tailored to meet specific business needs, whether for tracking website performance, monitoring sales metrics, or analyzing marketing campaigns. They save time and ensure consistency in reporting across different projects. For those of you who like to make quick decisions with precision, we’ve prepared a number of Google Looker Studio templates for you.
Start with simple tools for investigating web traffic and progress to more sophisticated tools. Every business must find the perfect set of analytic tools to grow. Consider the limitations of free versions of tools and prepare for each step on your way to end-to-end analytics.
Analyzing traffic statistics is crucial for gaining insights into website performance, keyword rankings, and competitor strategies.
Web traffic analytics is probably the first step of your journey to gain data clarity.